The effects of migration on evolutionary dynamics in natural populations of Drosophila melanogaster
2022-07-15
Evolutionary forces

Evolutionary forces: Drift


Evolutionary forces: Selection


Evolutionary forces: Selection - Local adaptation


Evolutionary forces: Mutations

Evolutionary forces: Gene flow


Adaptive Consequences of Gene Flow
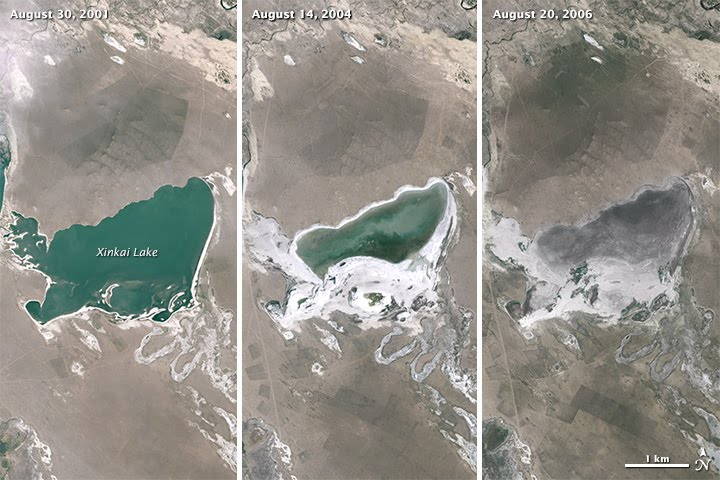
Rapidly and dynamically changing environments
Revisiting Gene flow - Changing environments

Rapid adaptation
Basis of Adaptive Response
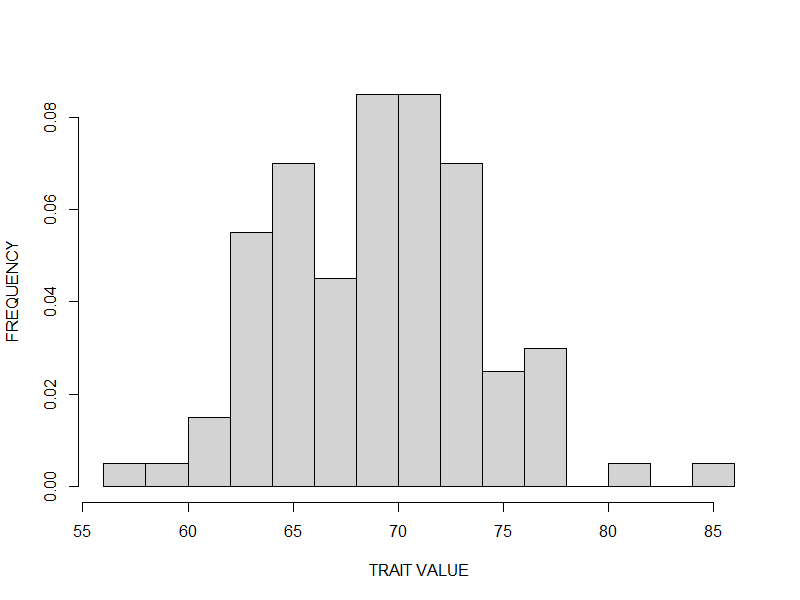
- Phenotypic variation
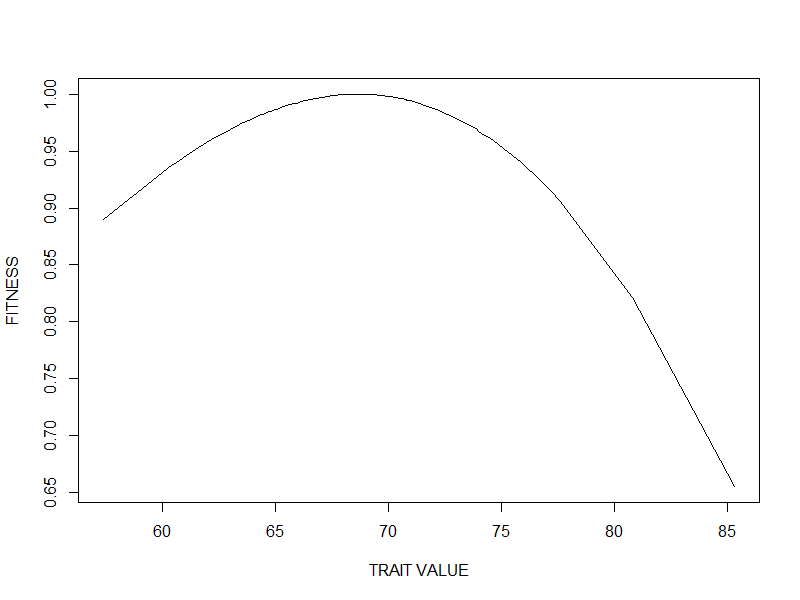
- Differential fitness
- Heritability of these traits
Basis of Adaptive Response
- Phenotypic variation
- Differential fitness
- Heritability of these traits
Basis of Adaptive Response
- Phenotypic variation
- Differential fitness
- Heritability of these traits
Basis of Adaptive Response
- Phenotypic variation
- Differential fitness
- Heritability of these traits
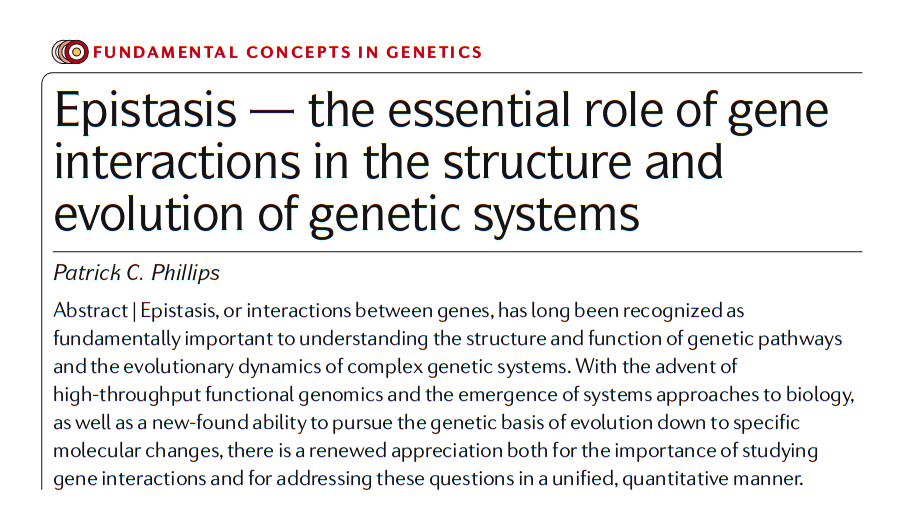
Genetic Architecture of Fitness-Associated Traits
Epistasis - Functional
- Functional
- Statistical
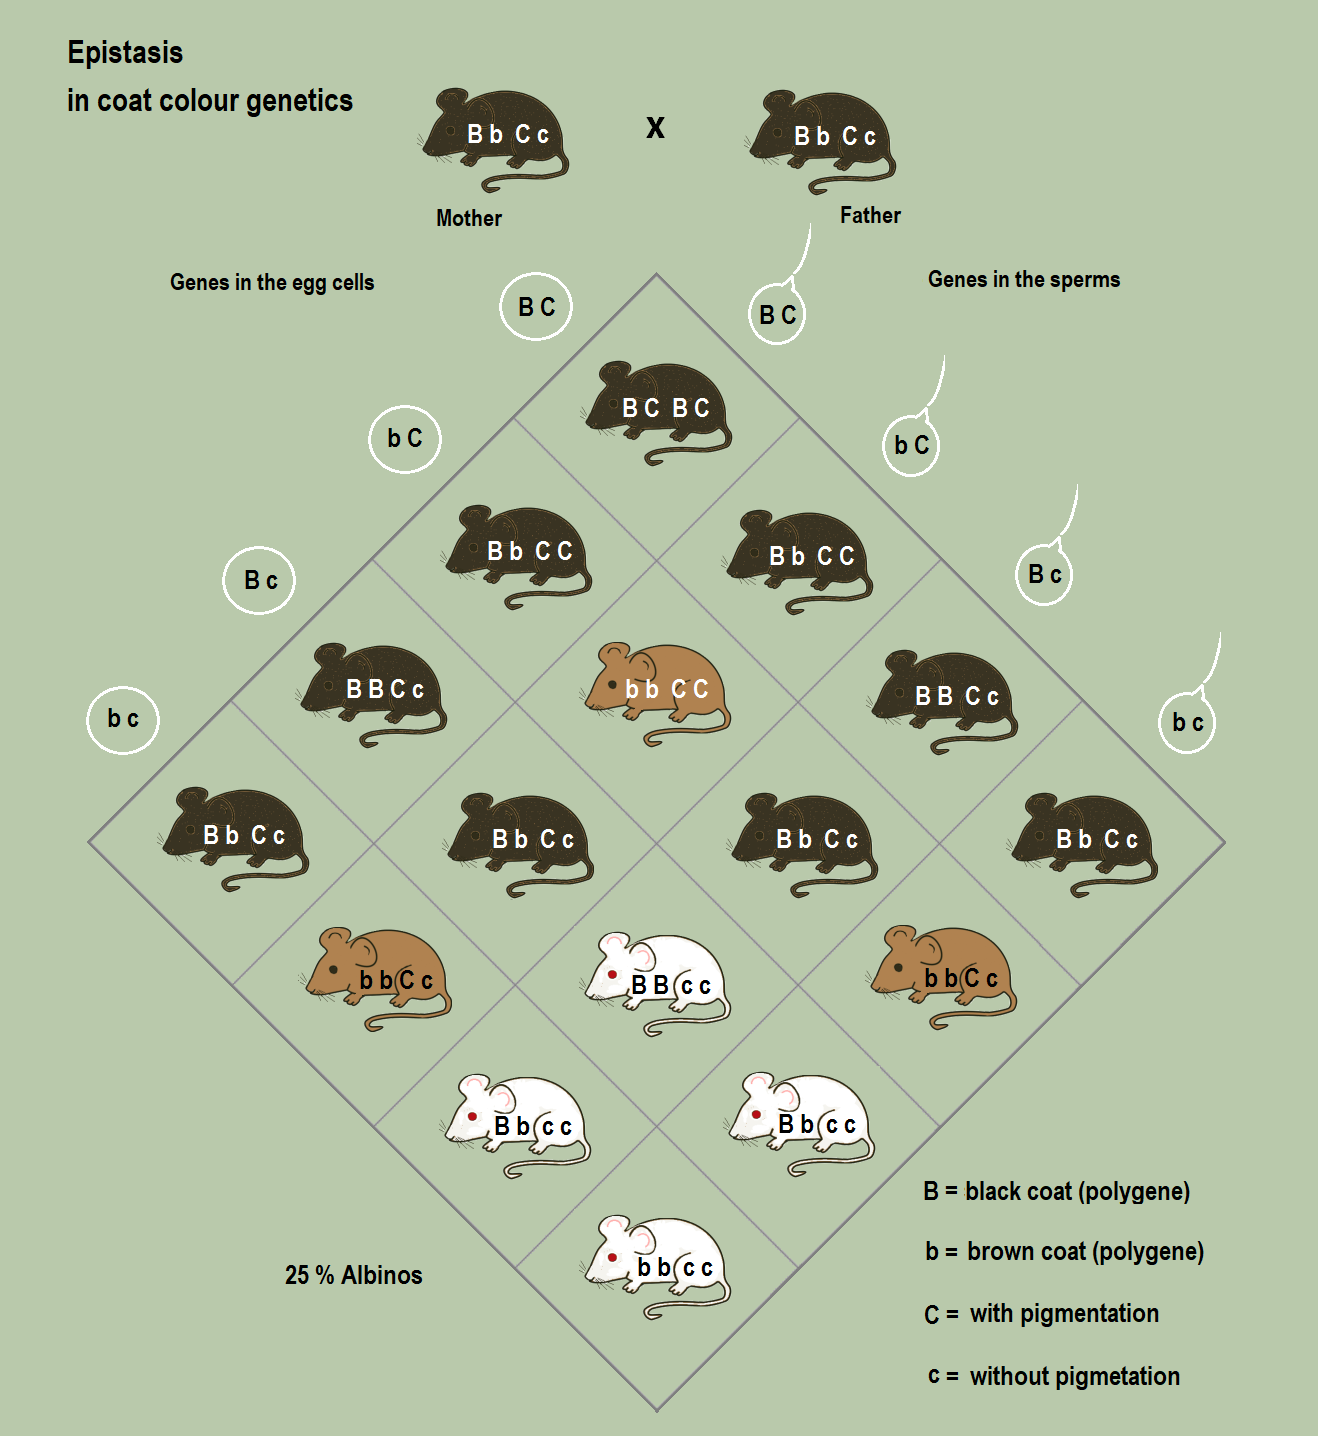
Epistasis - Statistical
- Functional
- Statistical
Gene Flow - Epistasis - Rapid Adaptation
- Classical understanding
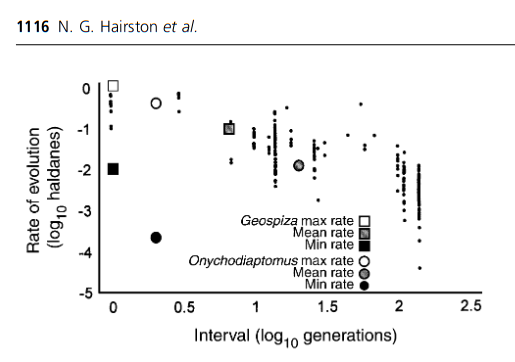
- Genetic architecture of complex traits
Gene Flow - Epistasis - Rapid Adaptation
- Classical understanding
- Dynamically changing environments
- Rapid adaptive responses
- Pervasive epistasis in complex traits
Gene Flow - Epistasis - Rapid Adaptation
- Classical understanding
- Dynamically changing environments
- Rapid adaptive responses
- Pervasive epistasis in complex traits
Gene Flow - Epistasis - Rapid Adaptation
- Classical understanding
- Dynamically changing environments
- Rapid adaptive responses
- Pervasive epistasis in complex traits
Gene Flow - Epistasis - Rapid Adaptation
- Classical understanding
- Dynamically changing environments
- Rapid adaptive responses
- Pervasive epistasis in complex traits
- Epistasis can be adaptive
Gene Flow - Epistasis - Rapid Adaptation
- Classical understanding
- Dynamically changing environments
- Rapid adaptive responses
- Pervasive epistasis in complex traits
- Epistasis can be adaptive
- Gene flow can also be adaptive

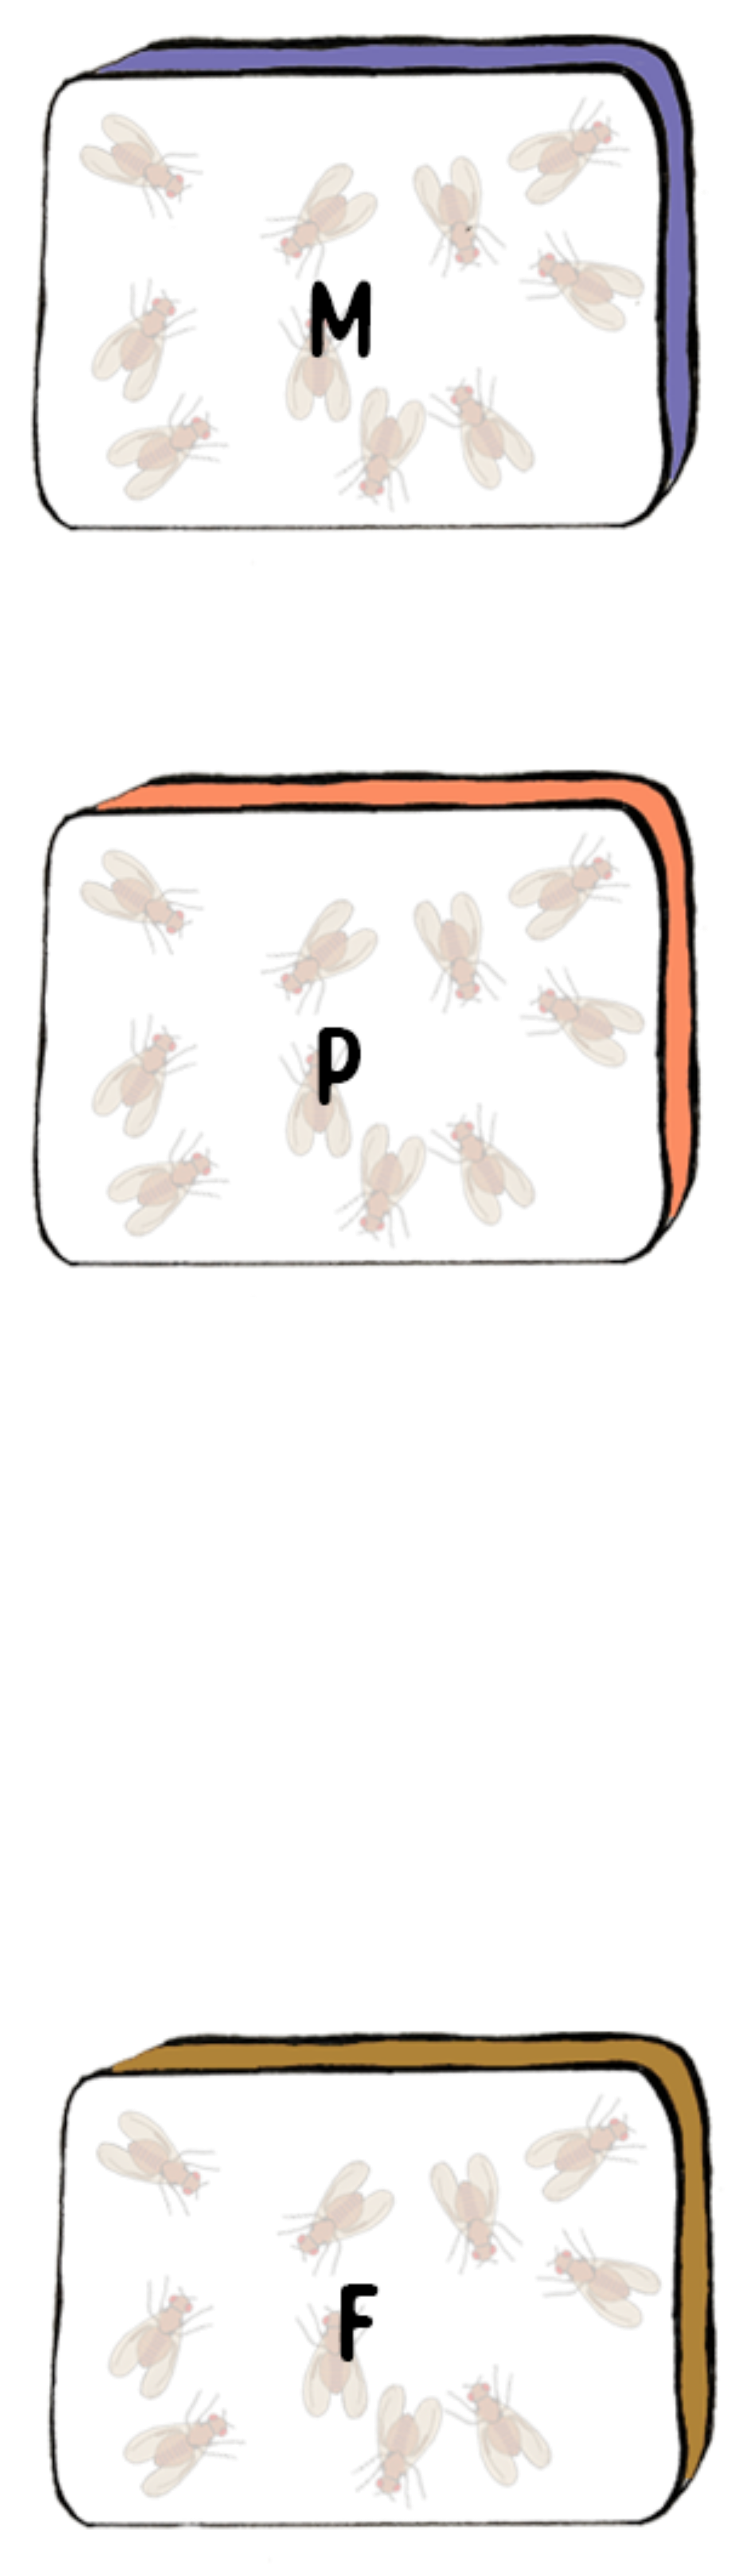
Migration Events
Let’s consider a simple model
- Focal population \(F\)
\(F\)

Migration Events
Let’s consider a simple model
- Focal population \(F\)
- Migrant population \(M\)
\(F\)

\(M\)
Migration Events
Let’s consider a simple model
- Focal population \(F\)
- Migrant population \(M\)
- Unidirectional Migration
- From \(M\) to \(F\)
- Single time
\(F\)
\(M\)

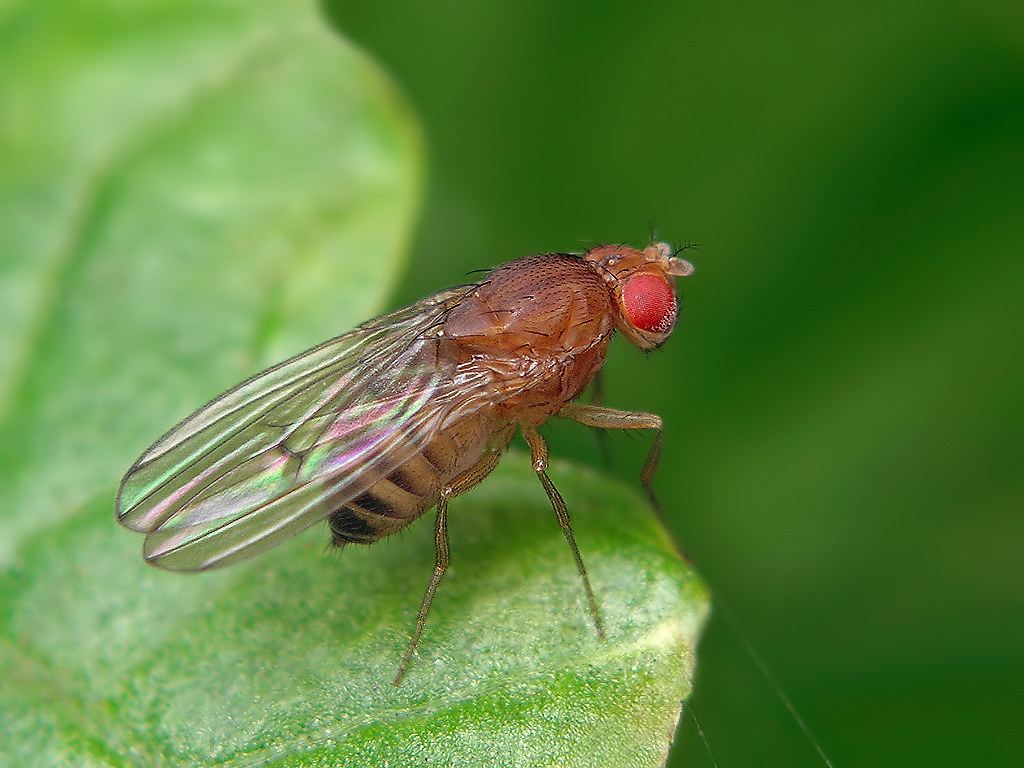
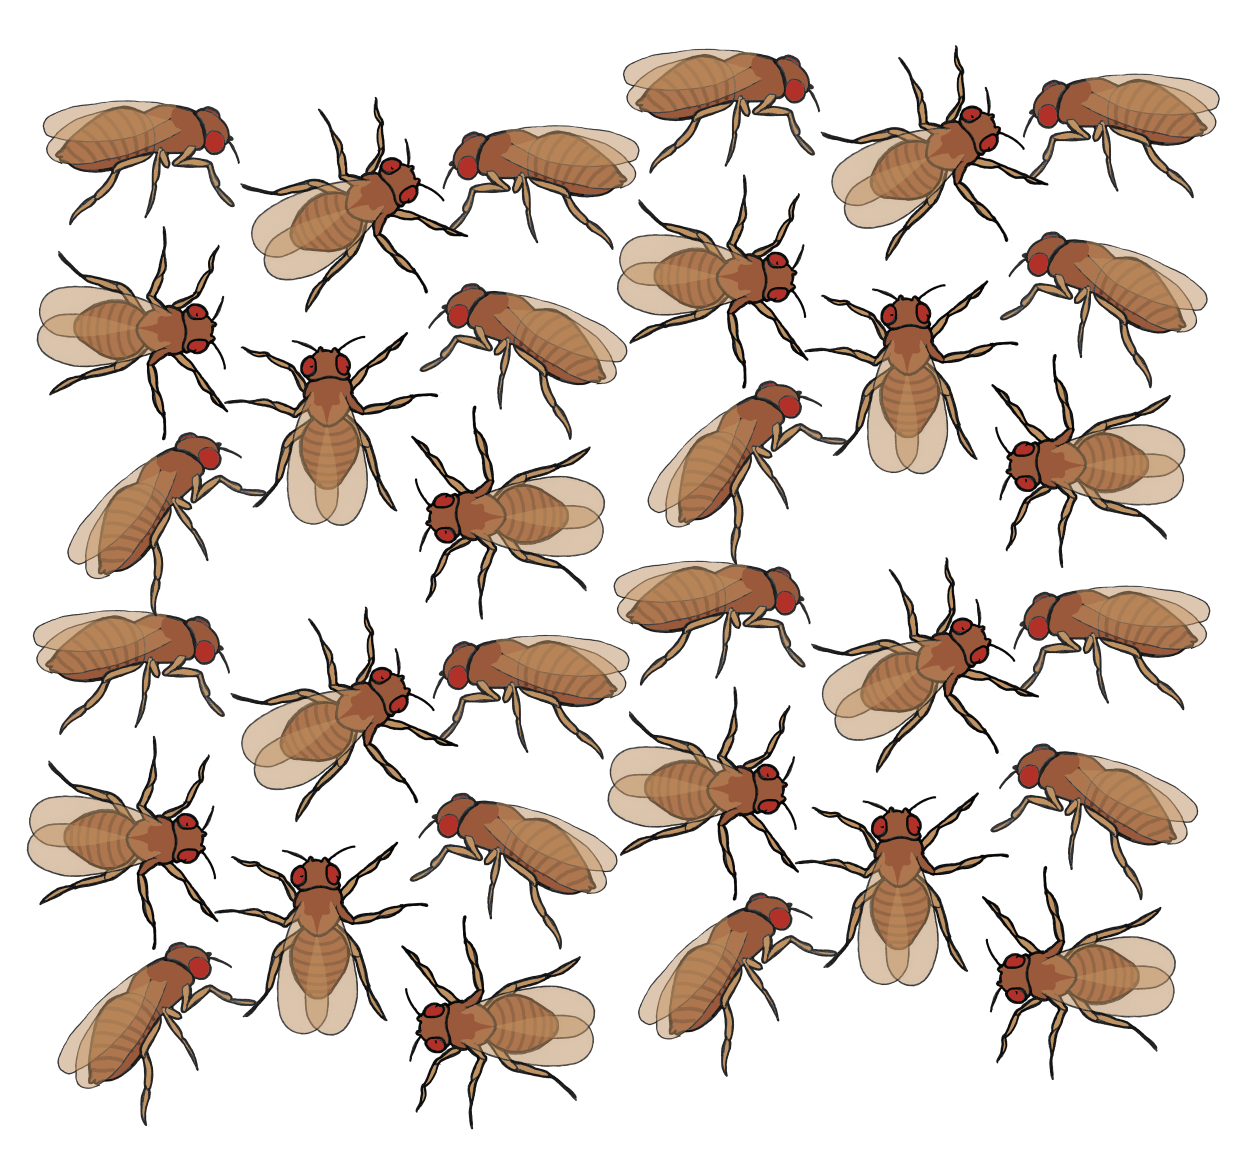
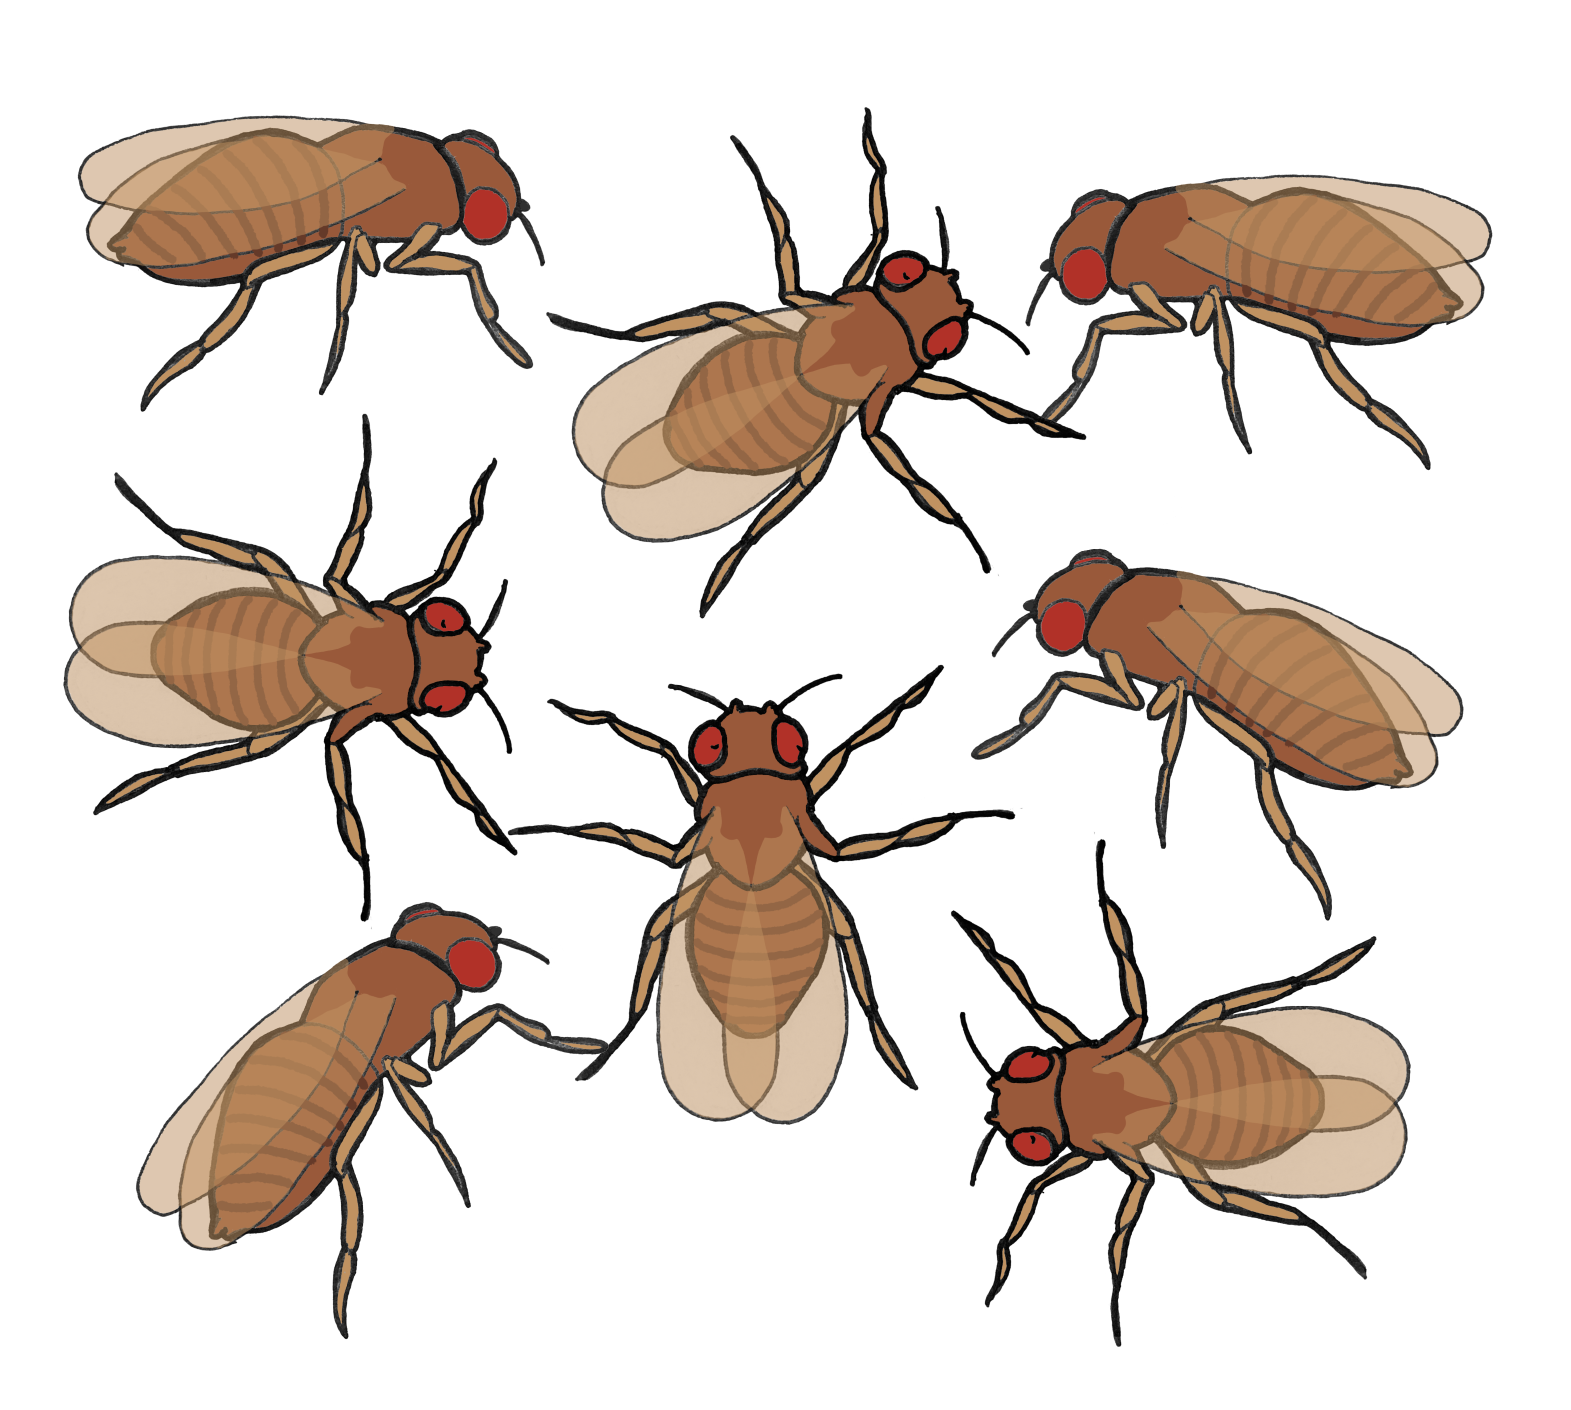
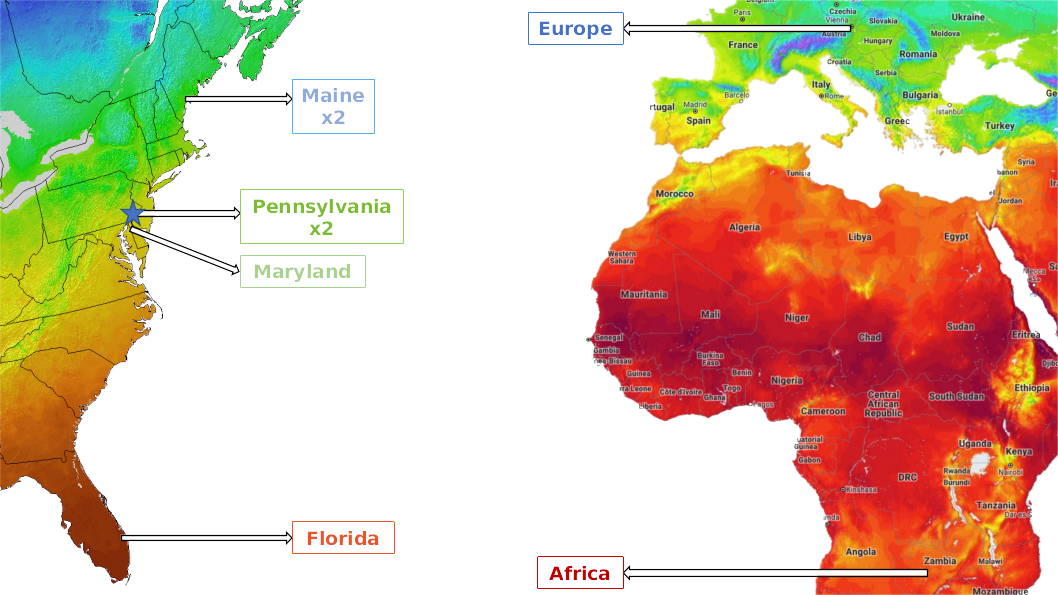
Best(!) Model System: Drosophila melanogaster
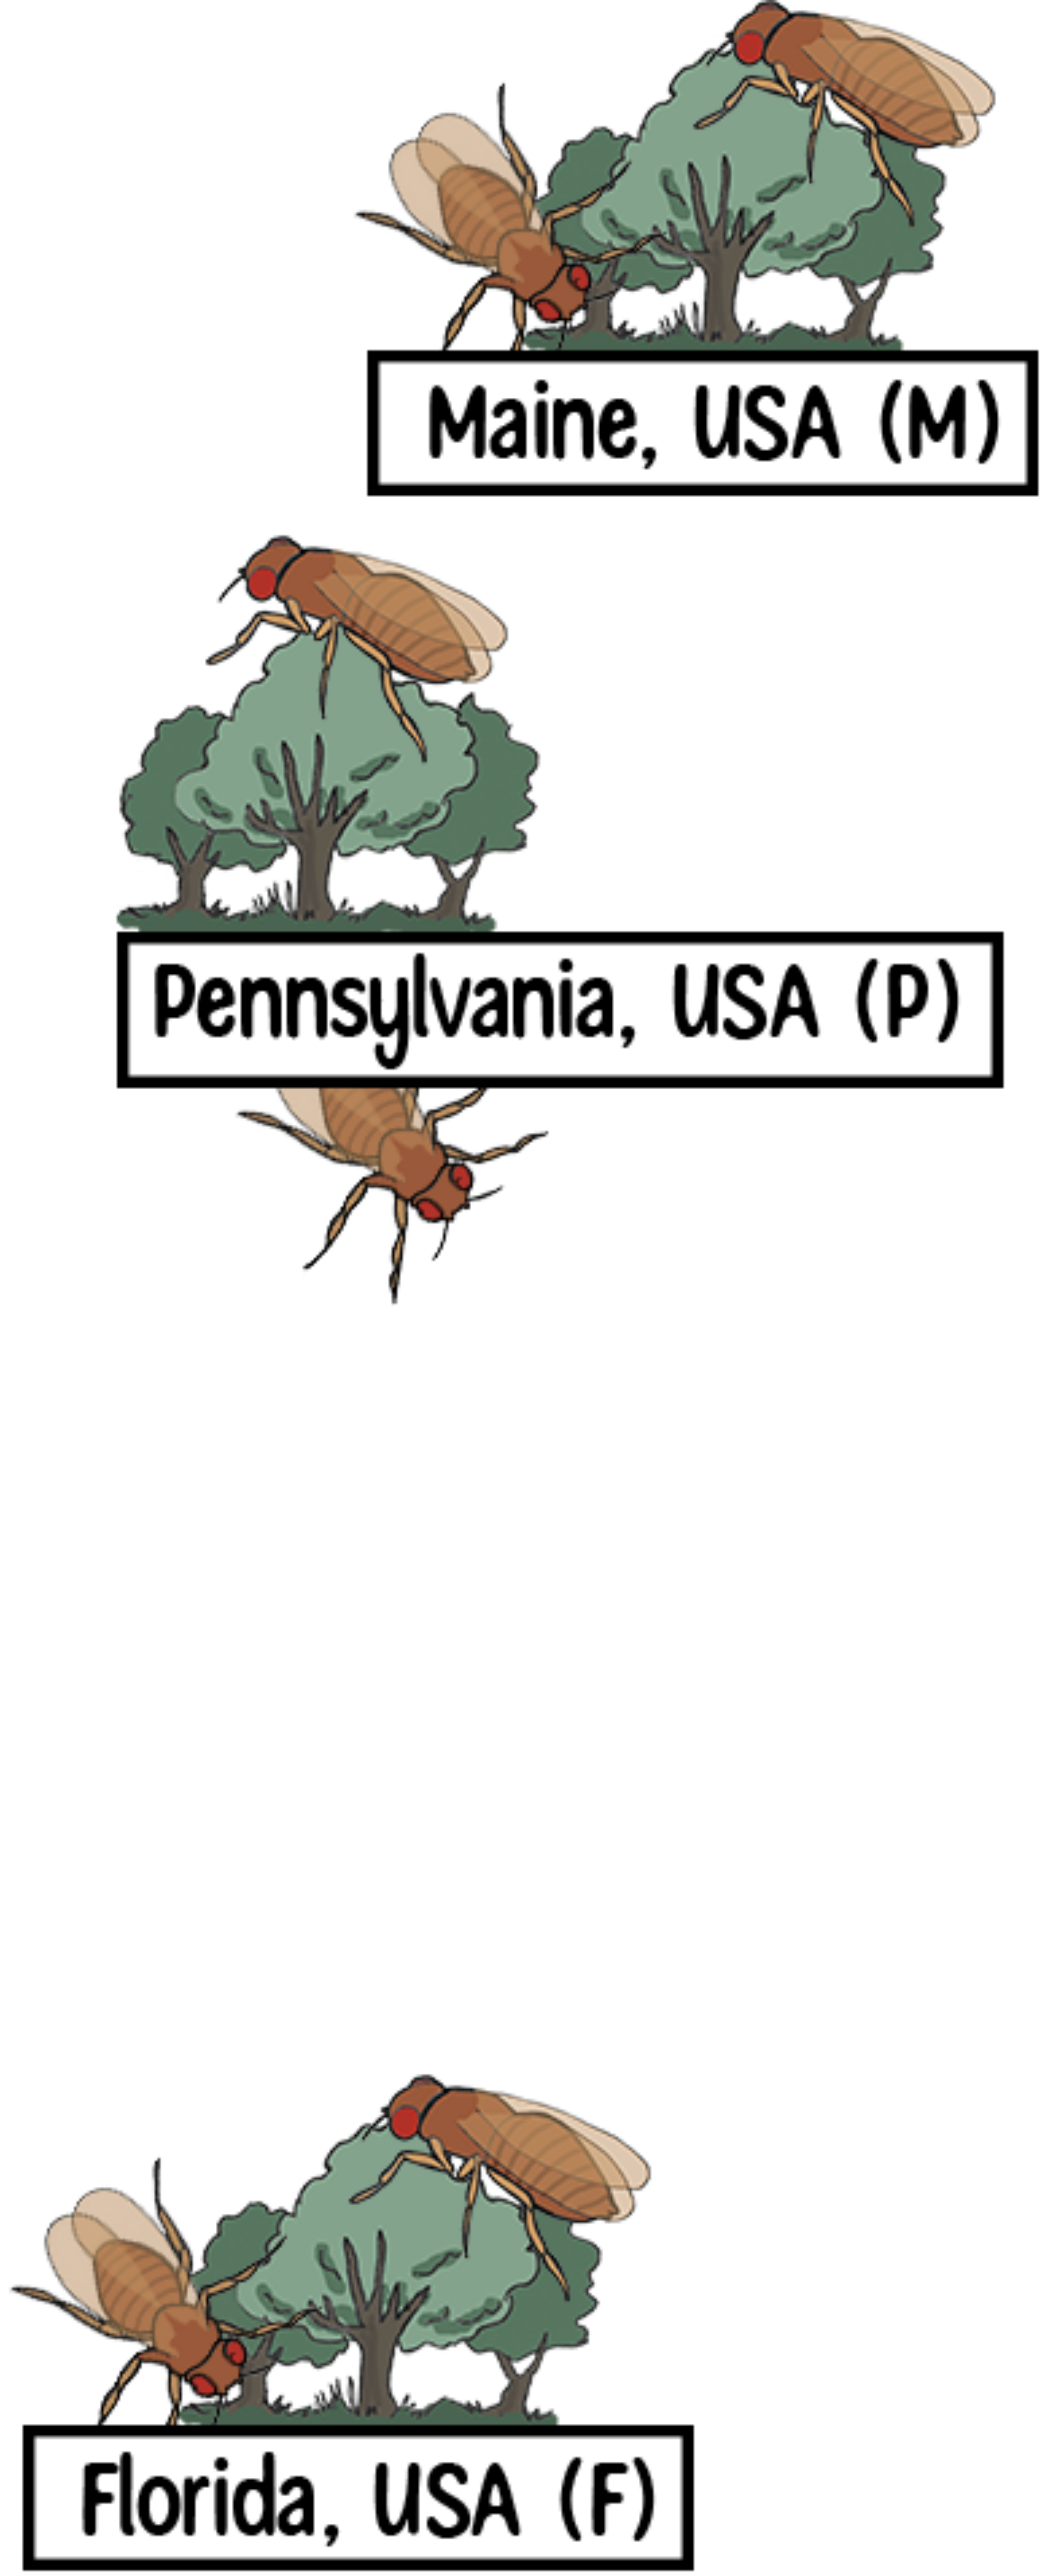
Population Demography of D. melanogaster

Singh and Long (1992)
Local Adaptation and Latitudinal Clines
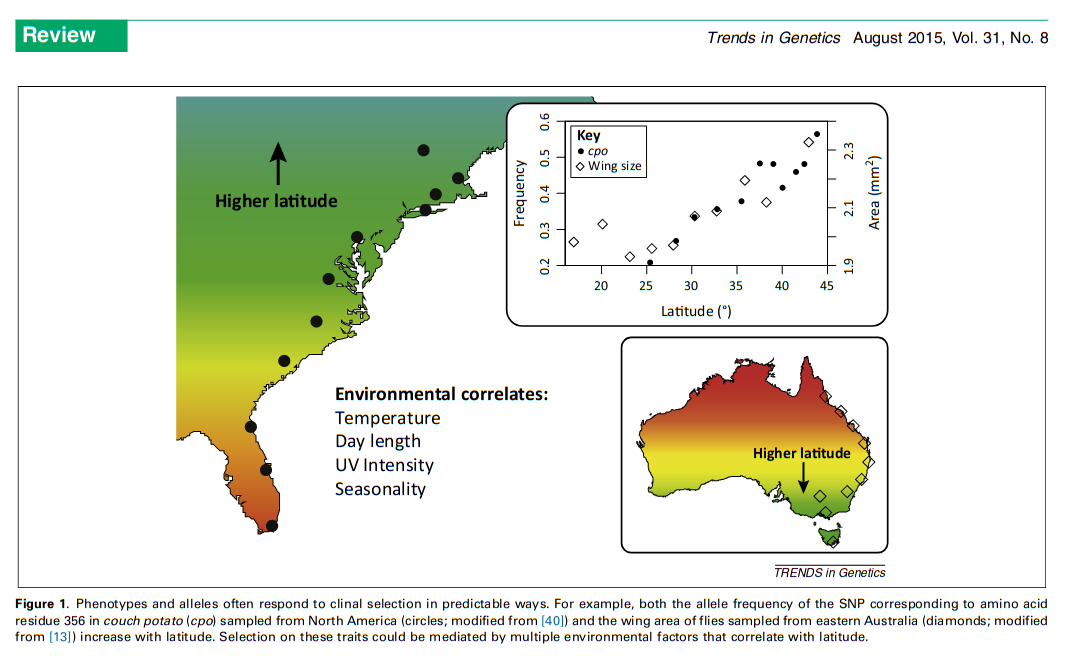
Adrion et al. (2015)
Rapid Adaptation
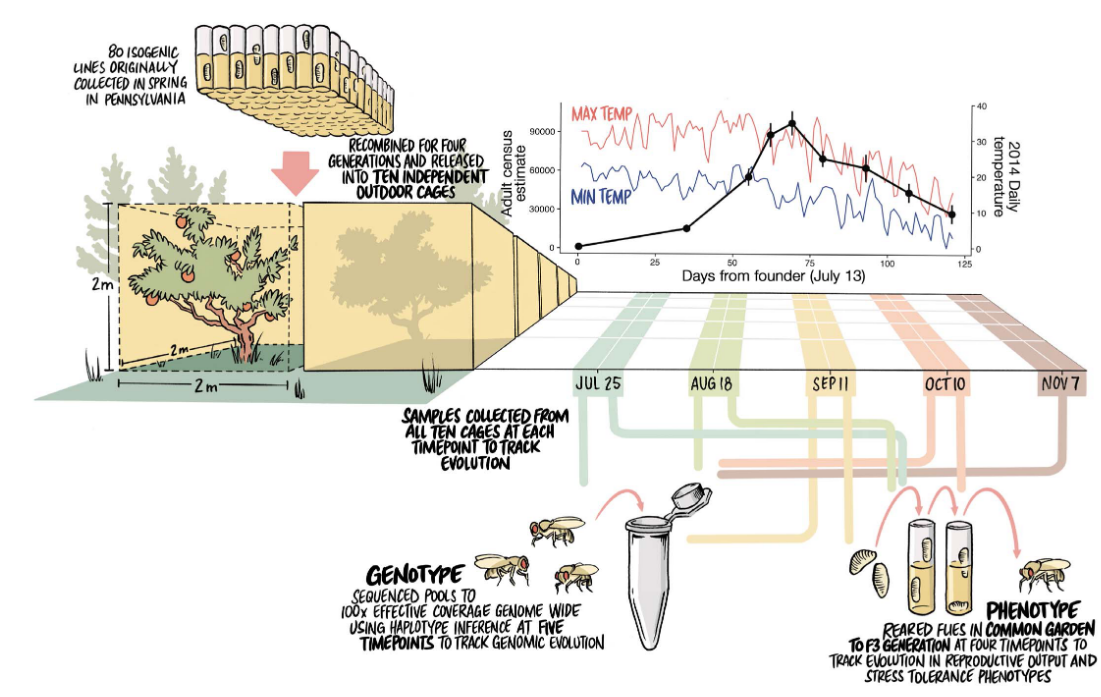
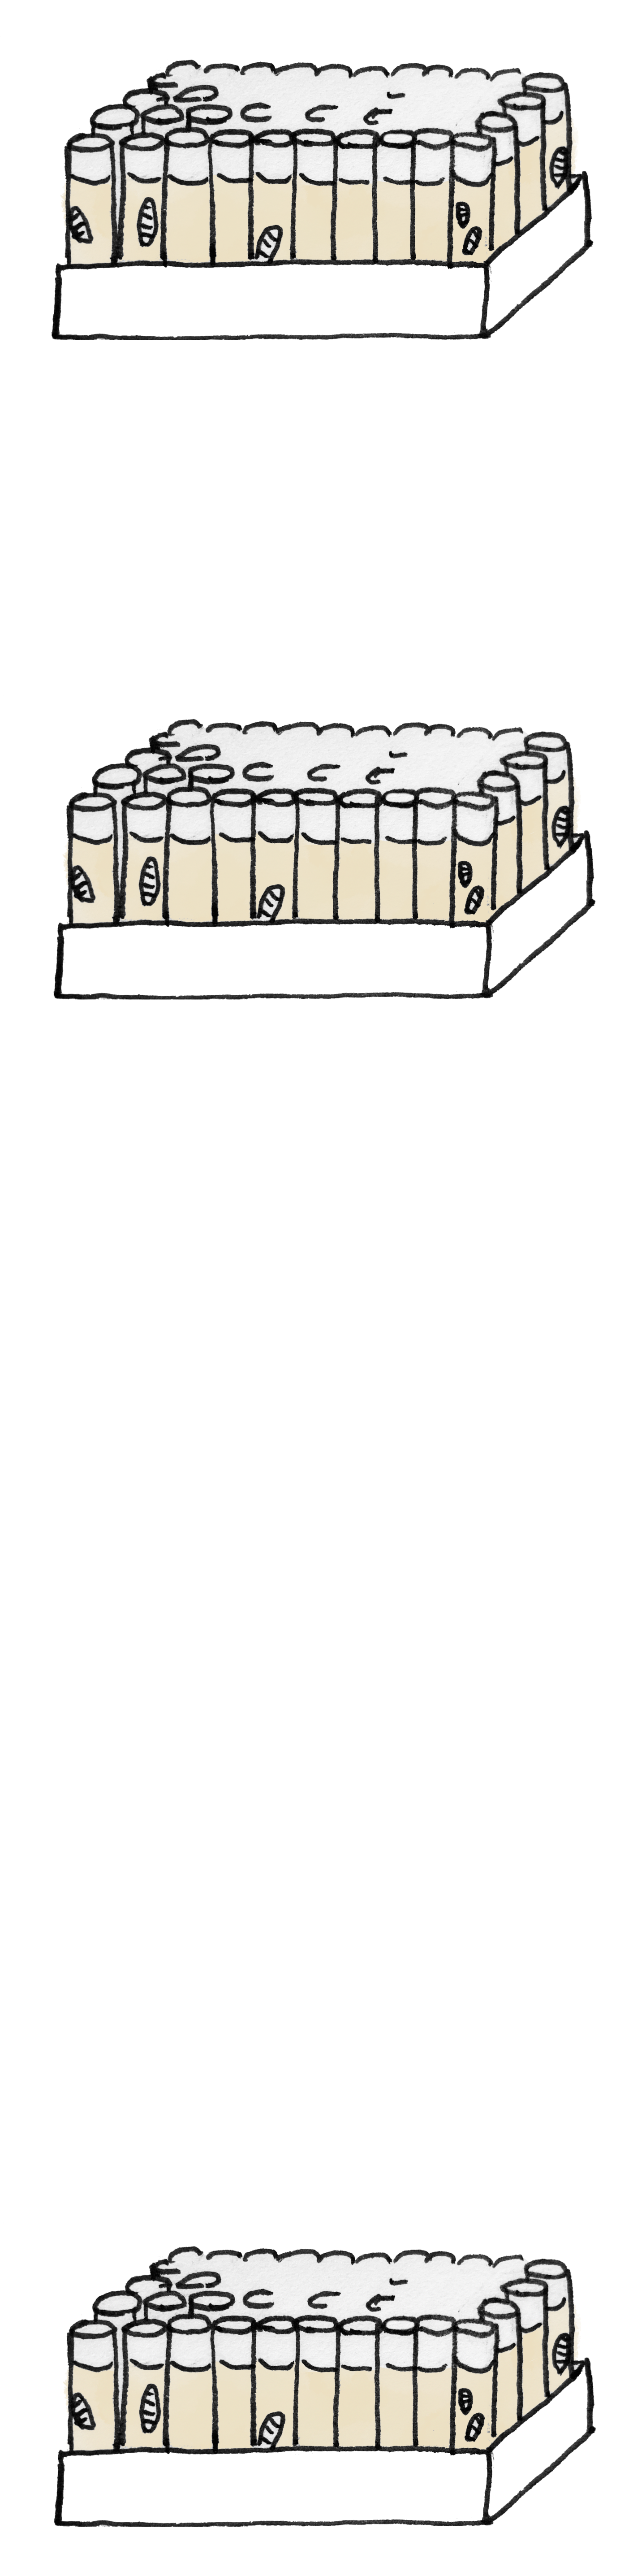
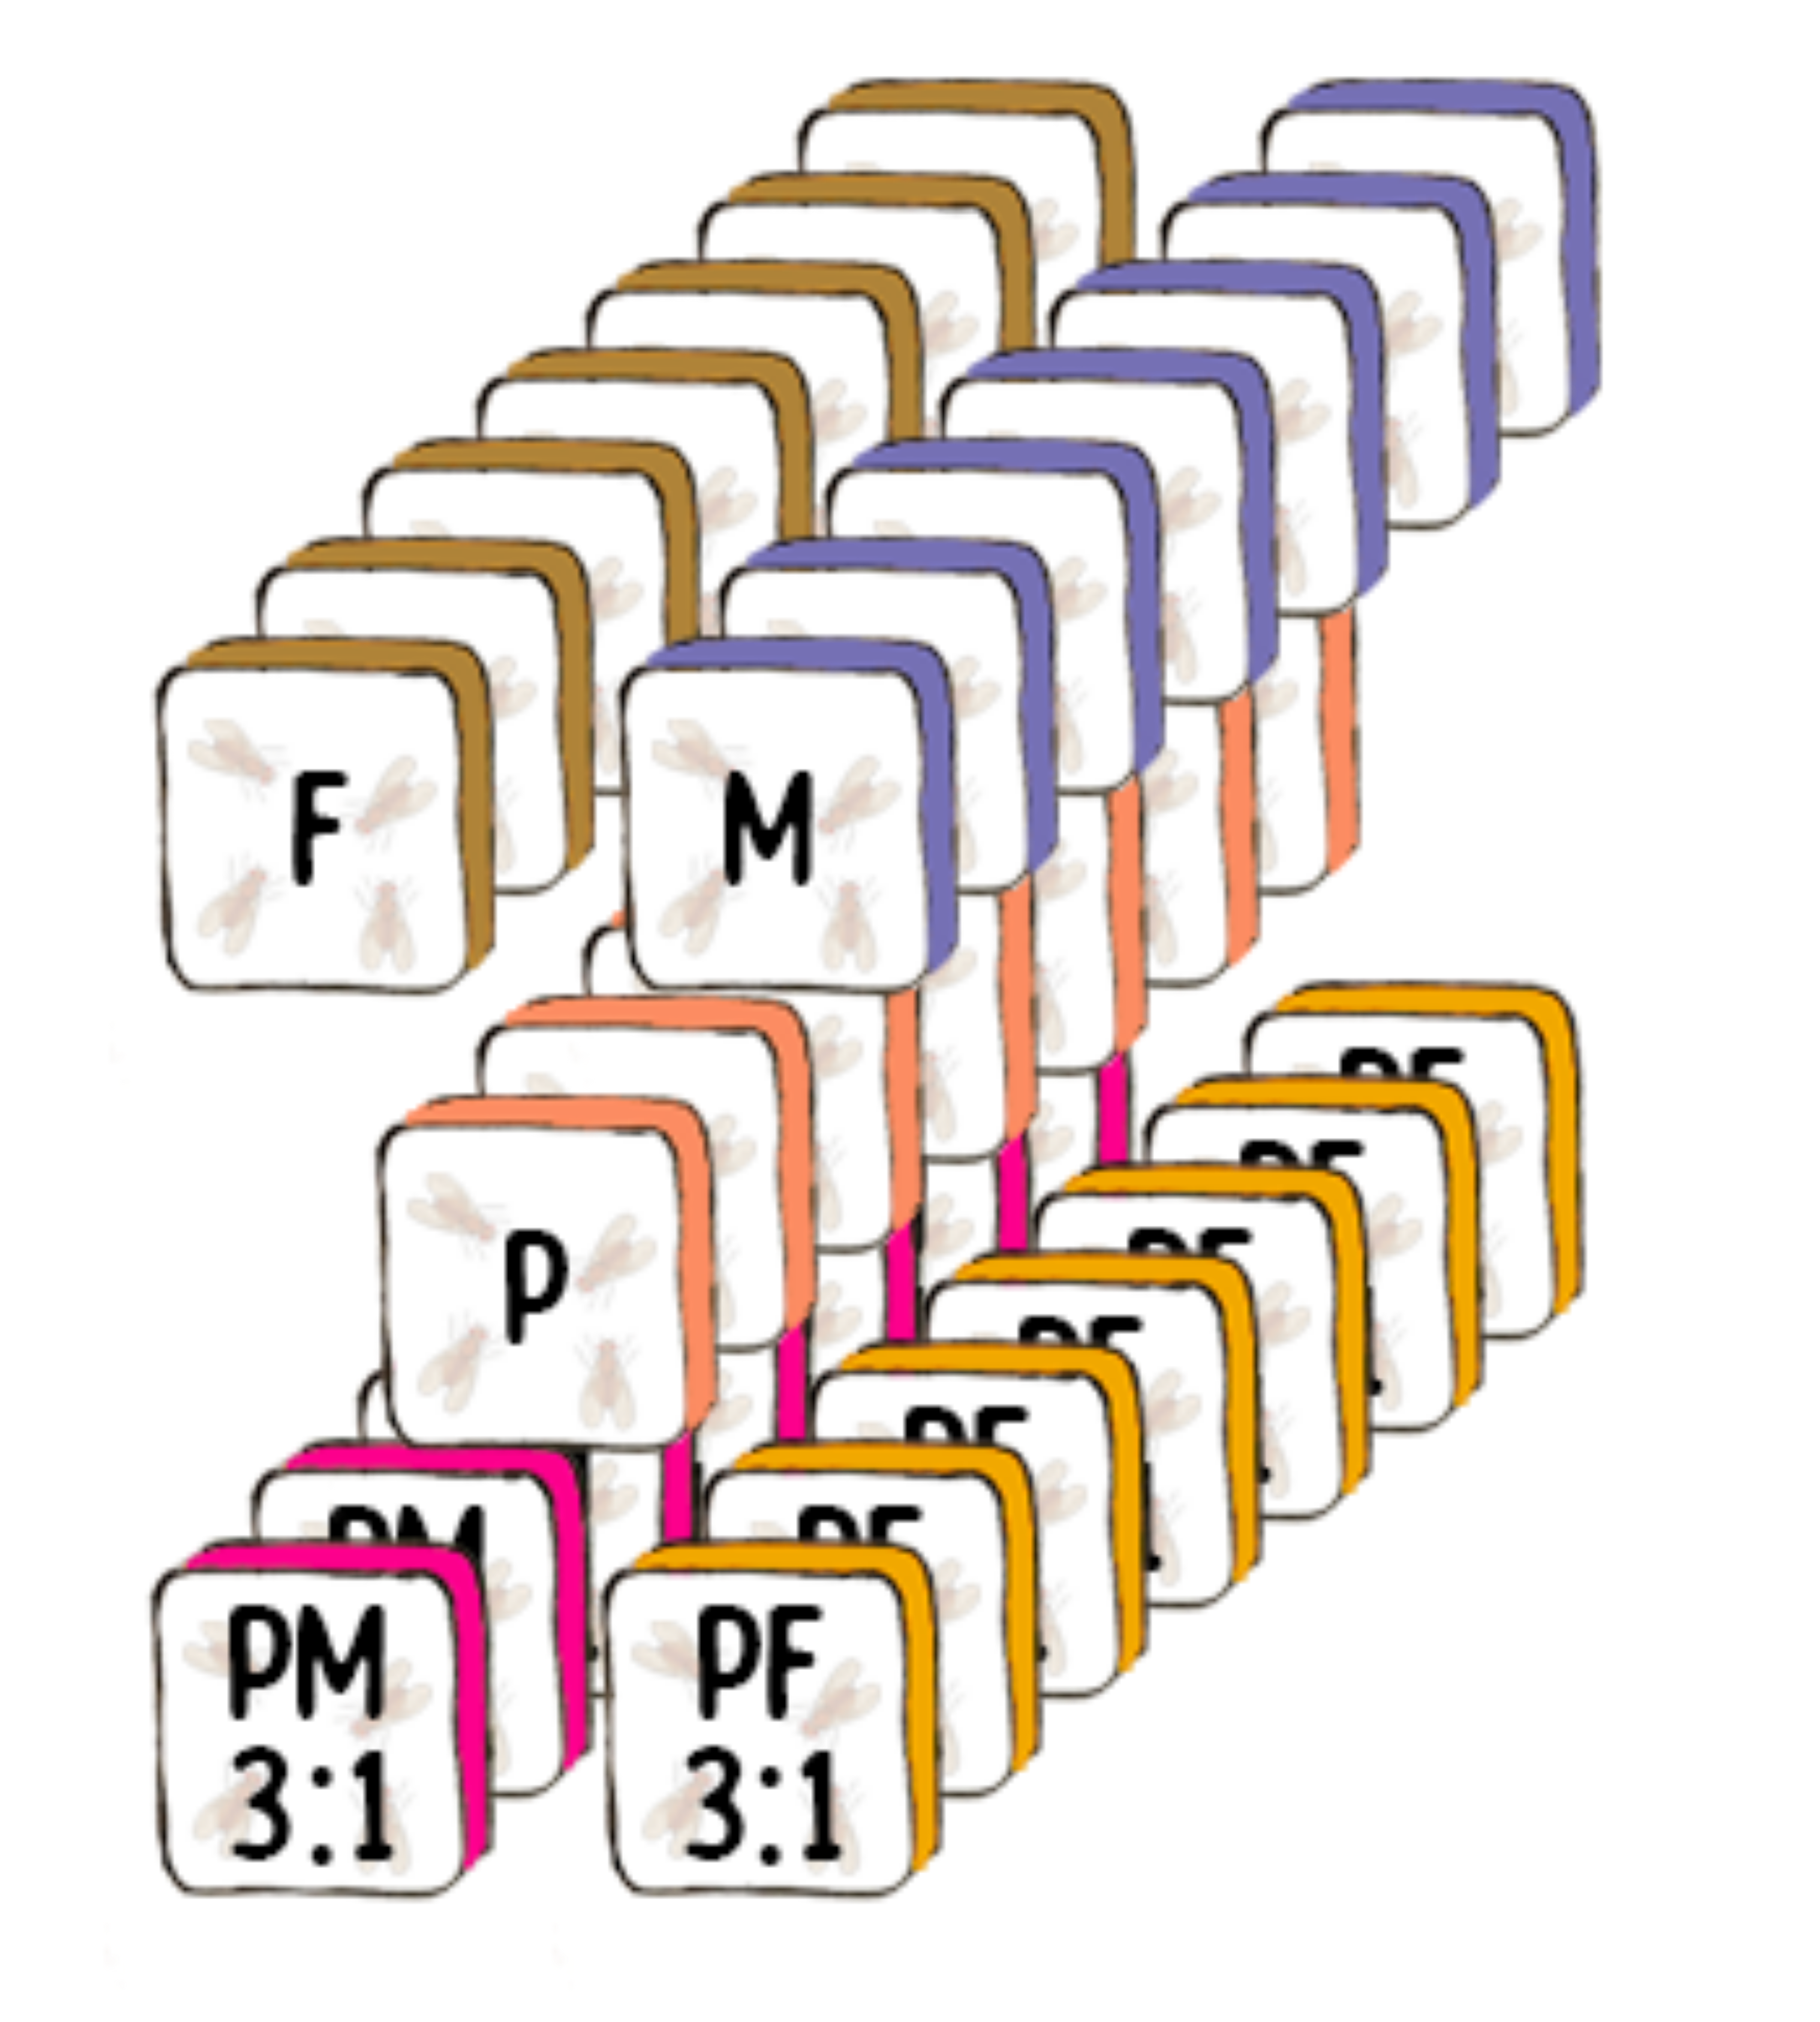
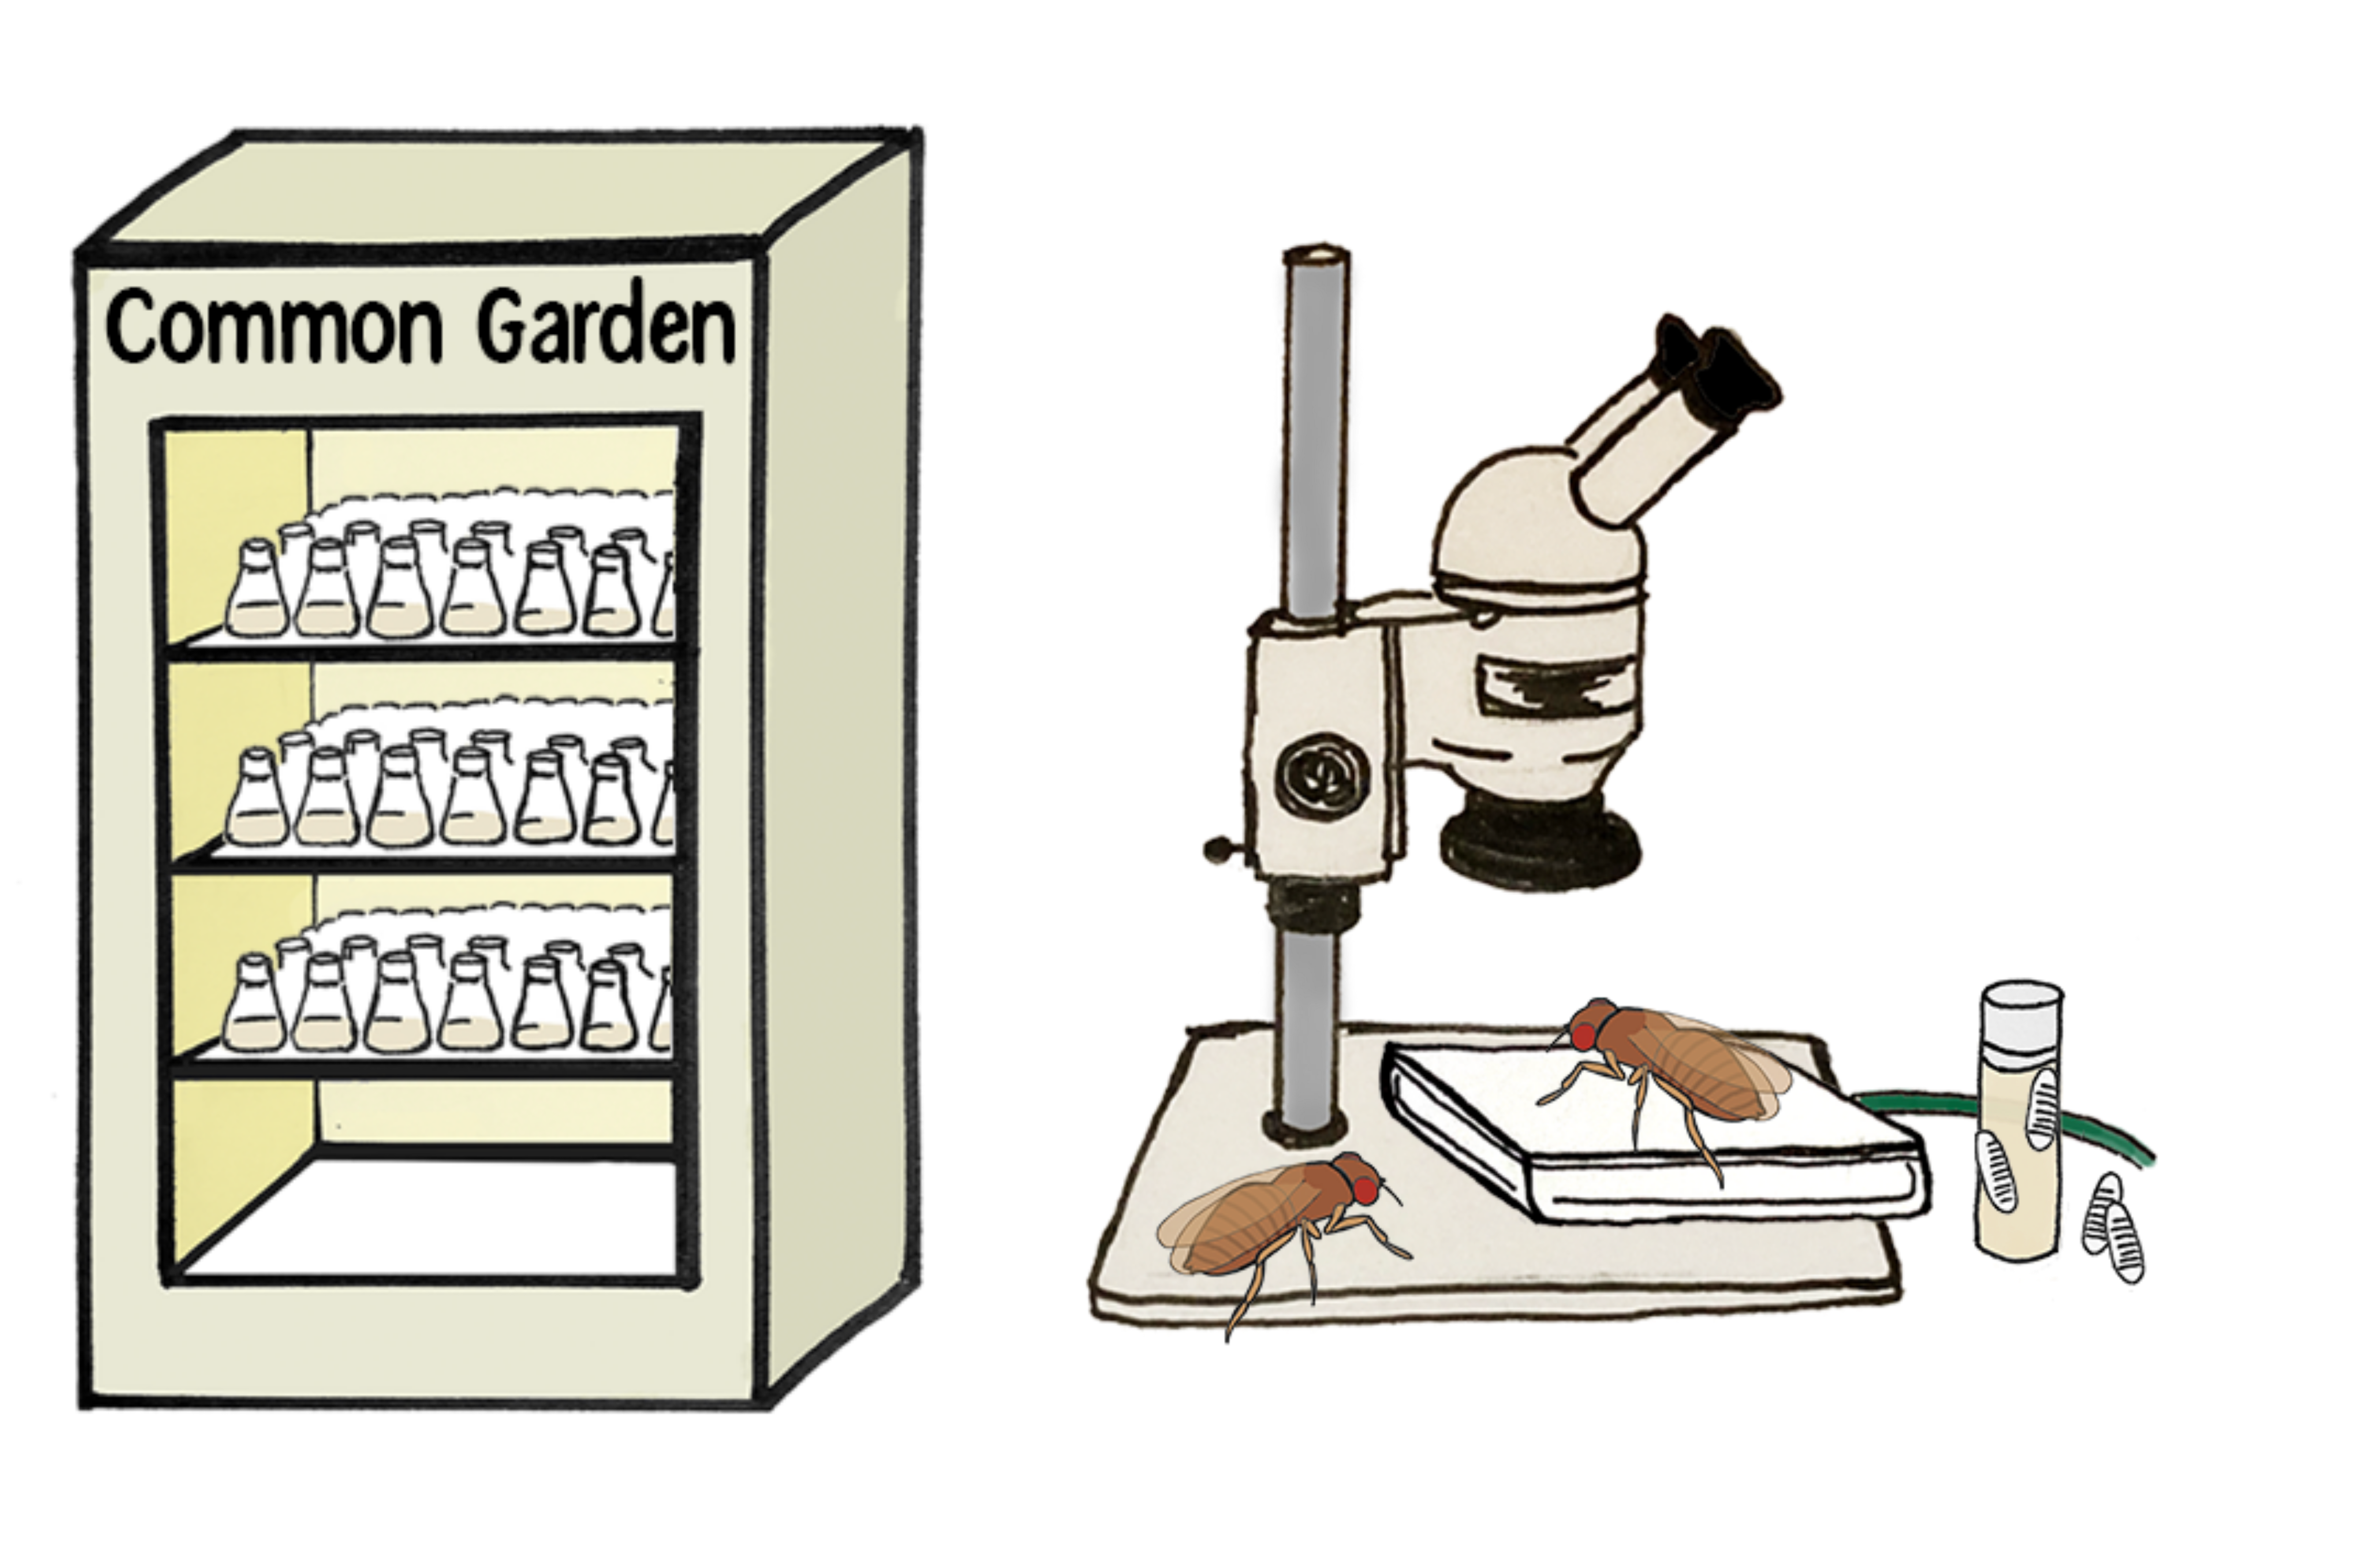
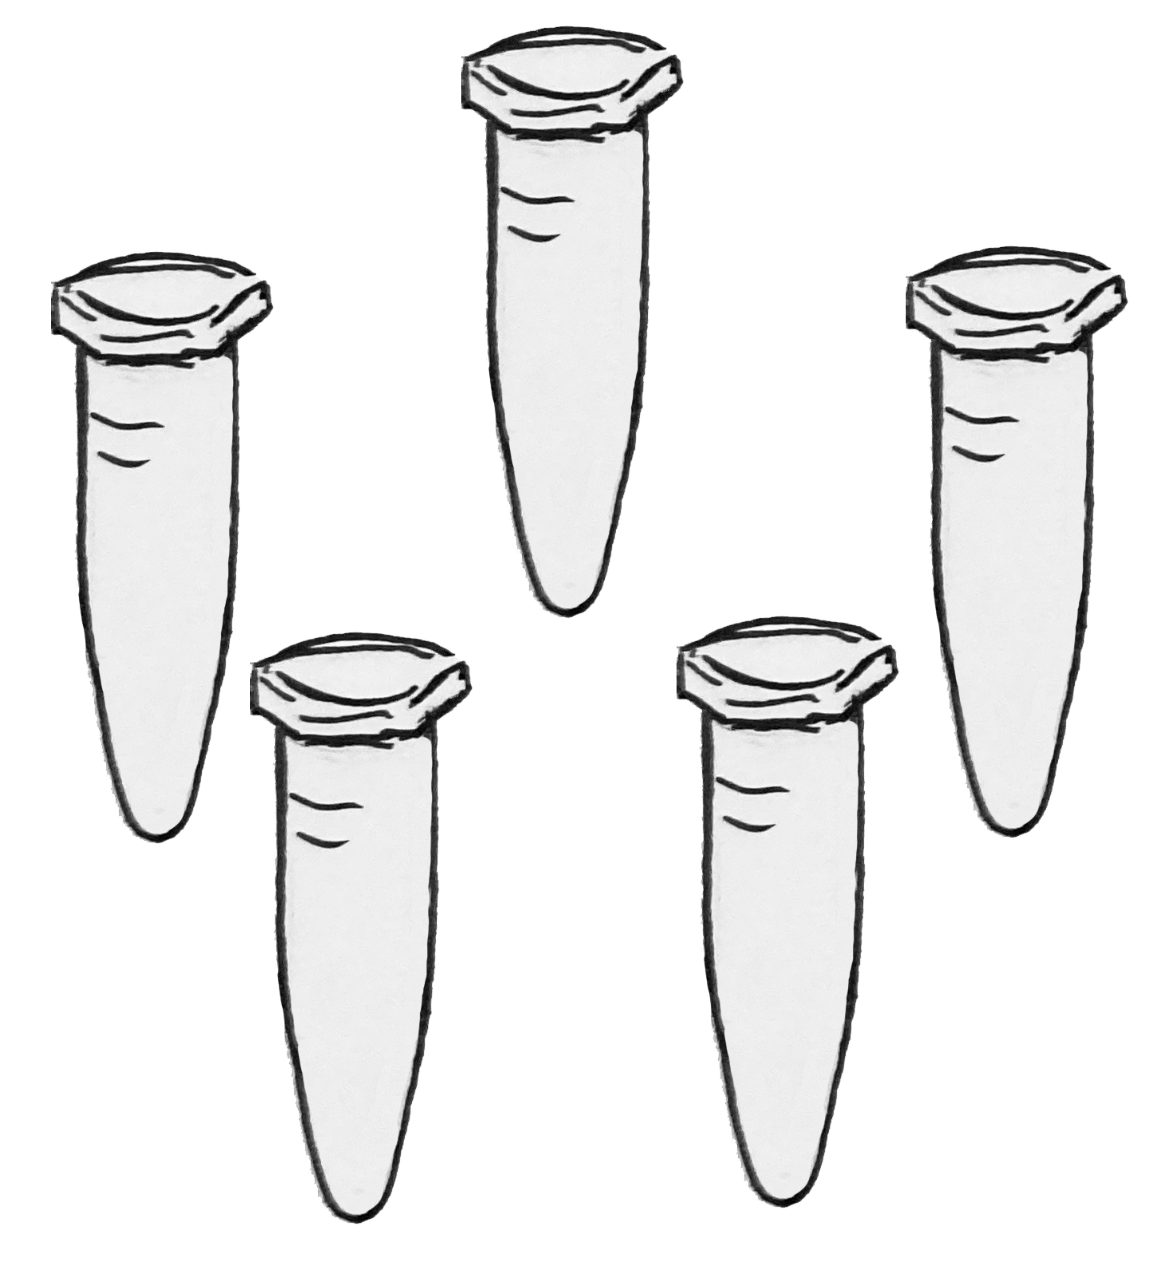
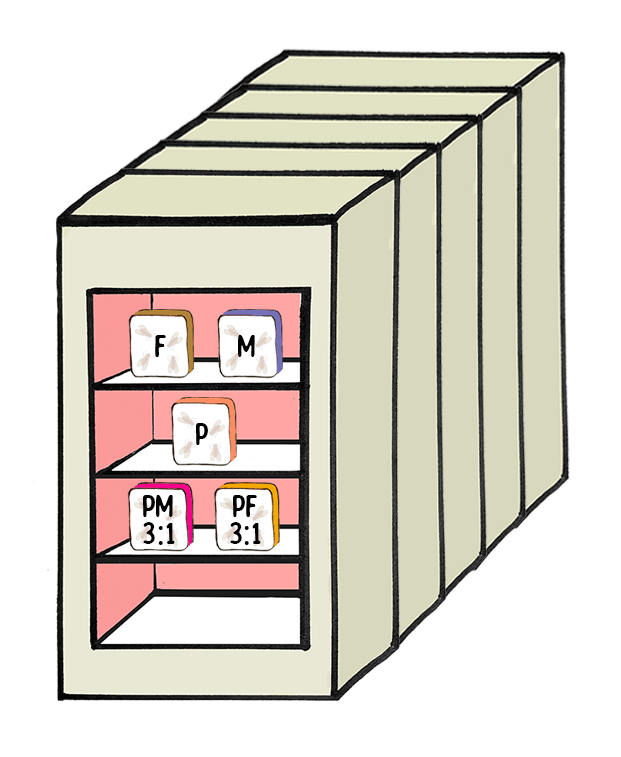
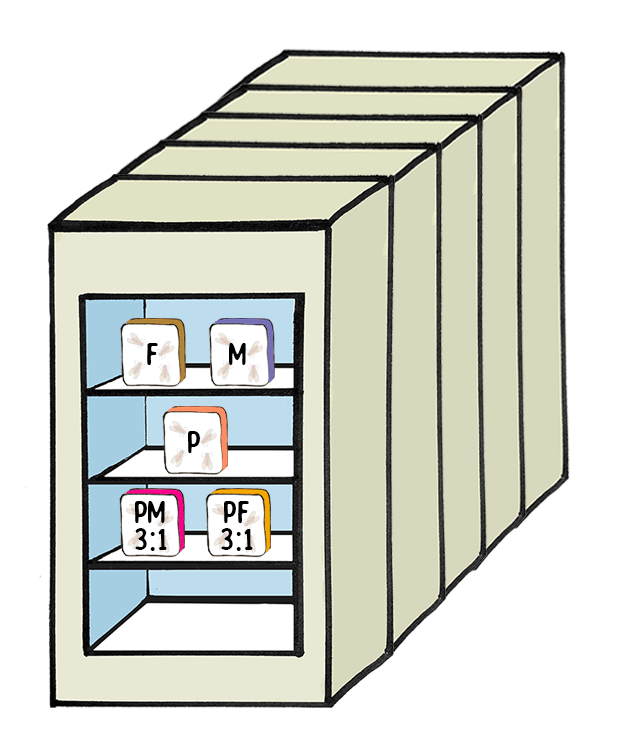
Experimental Design
![]()
Experimental Design
![]()


Experimental Design
![]()
Experimental Design
![]()
Experimental Design
![]()


Experimental Design
![]()
Experimental Design
![]()
Experimental Design


Experimental Design
Experimental Design
Experimental Design


Experimental Design
Experimental Design
Experimental Design
Experimental Design
Experimental Design
Experimental Design
Experimental Design
Results: Fitness Effects of 1:1 Gene Flow
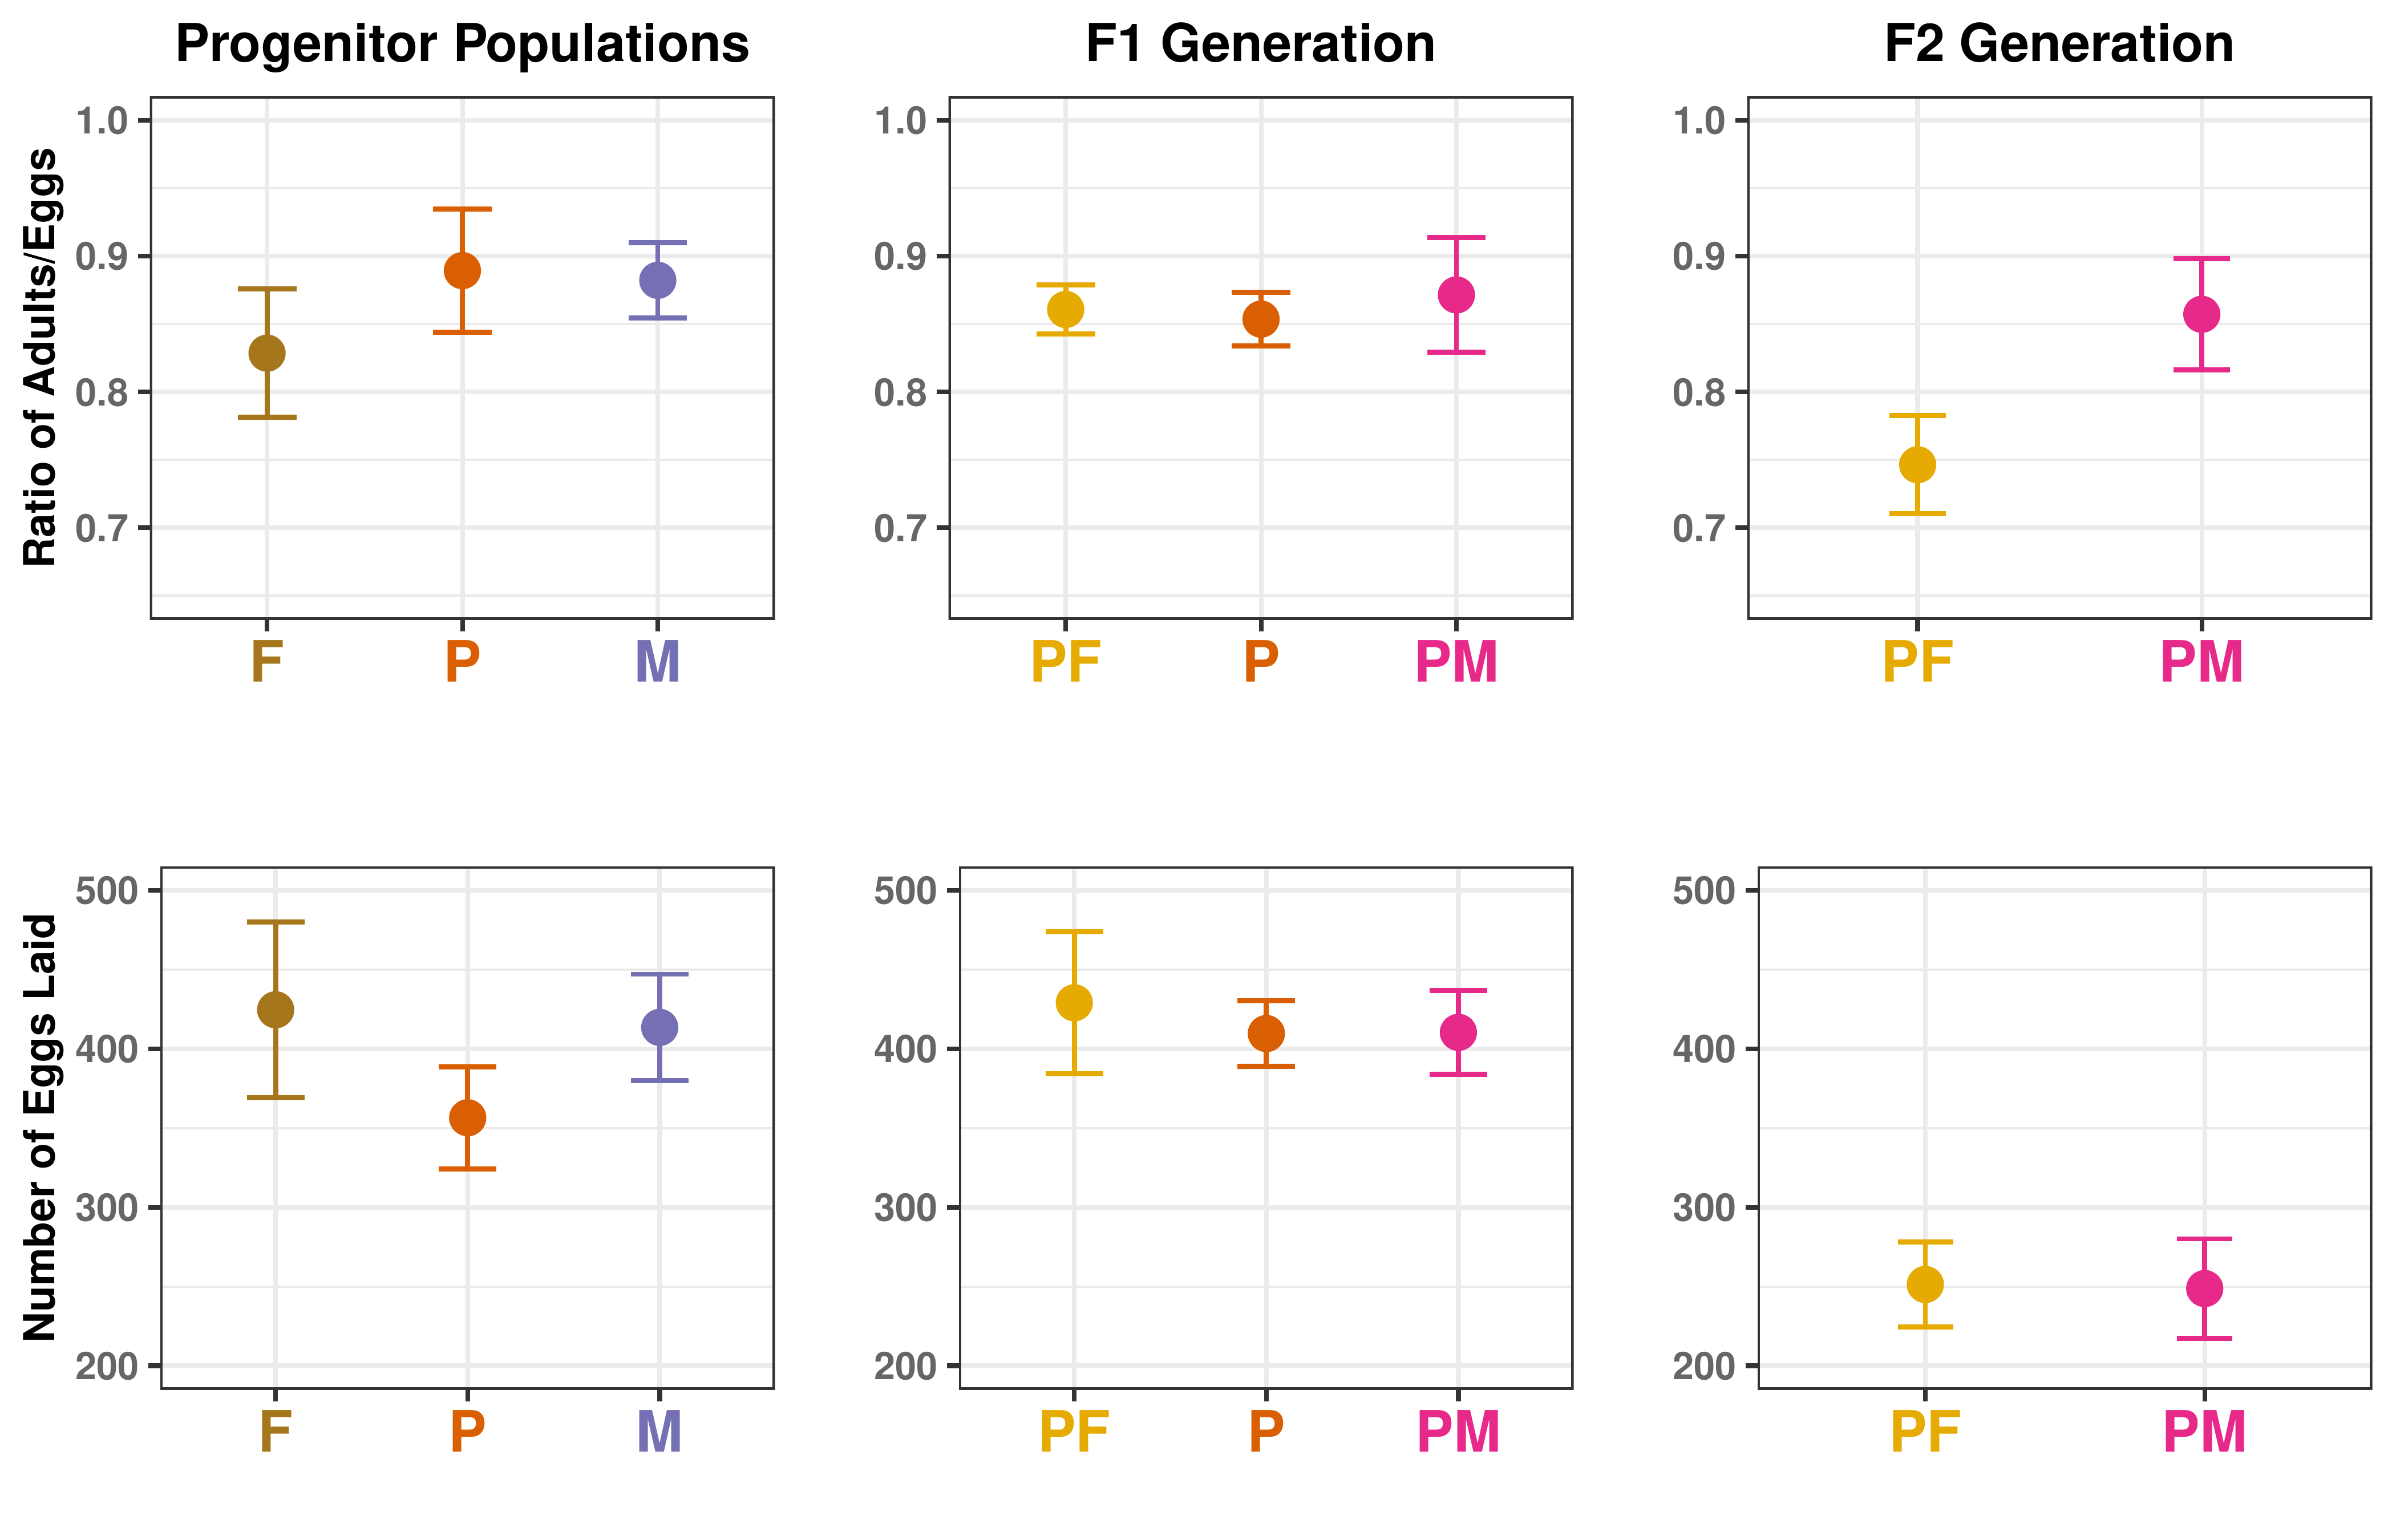
Results: Gene Flow as a Result of a Migration Event
| F | PF | P | PM | |
|---|---|---|---|---|
| PF | 137.115 | |||
| P | 148.423 | 77.341 | ||
| PM | 144.548 | 68.203 | 75.732 | |
| M | 157.985 | 97.717 | 100.952 | 89.629 |
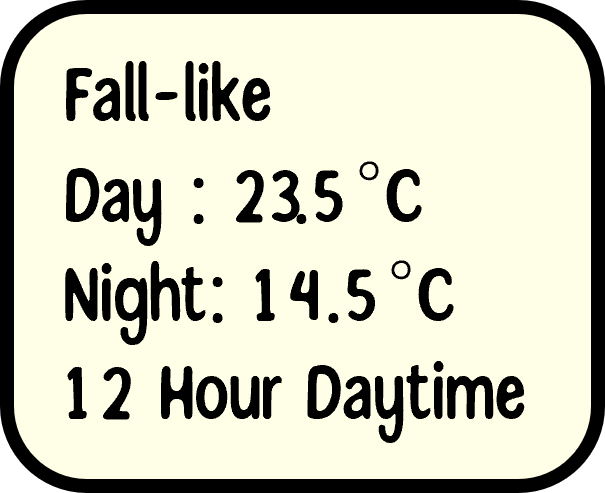
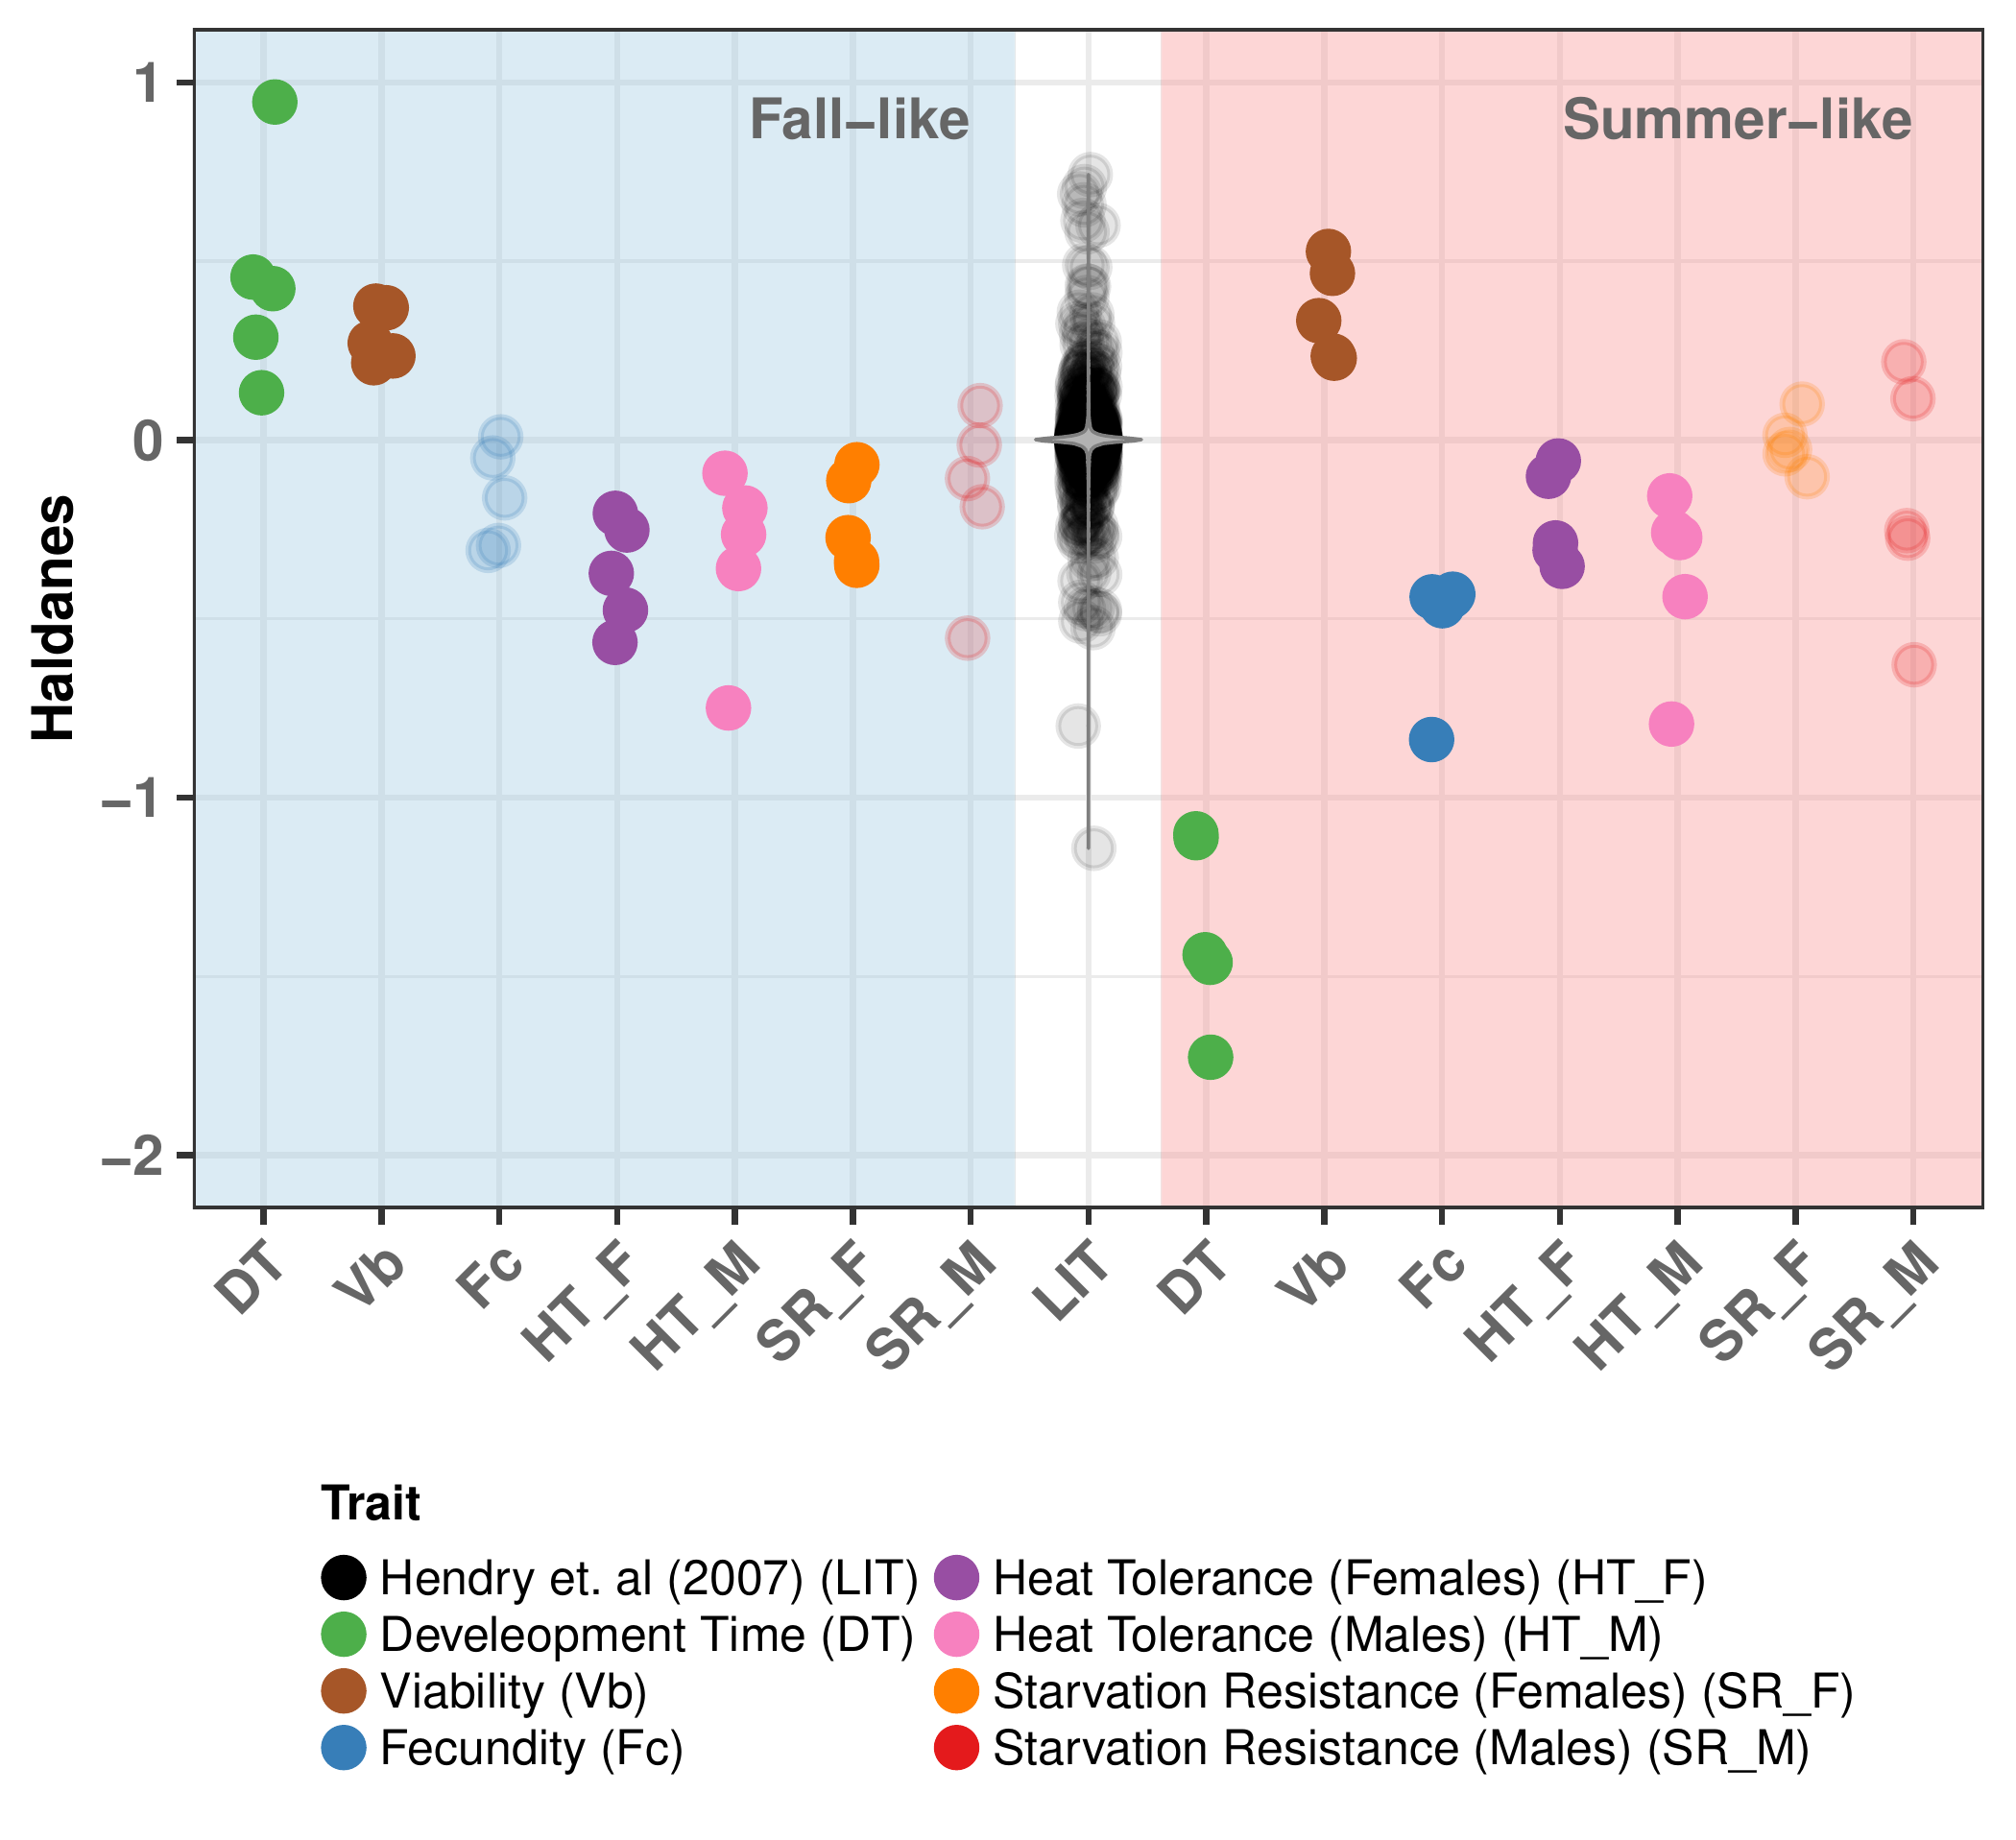
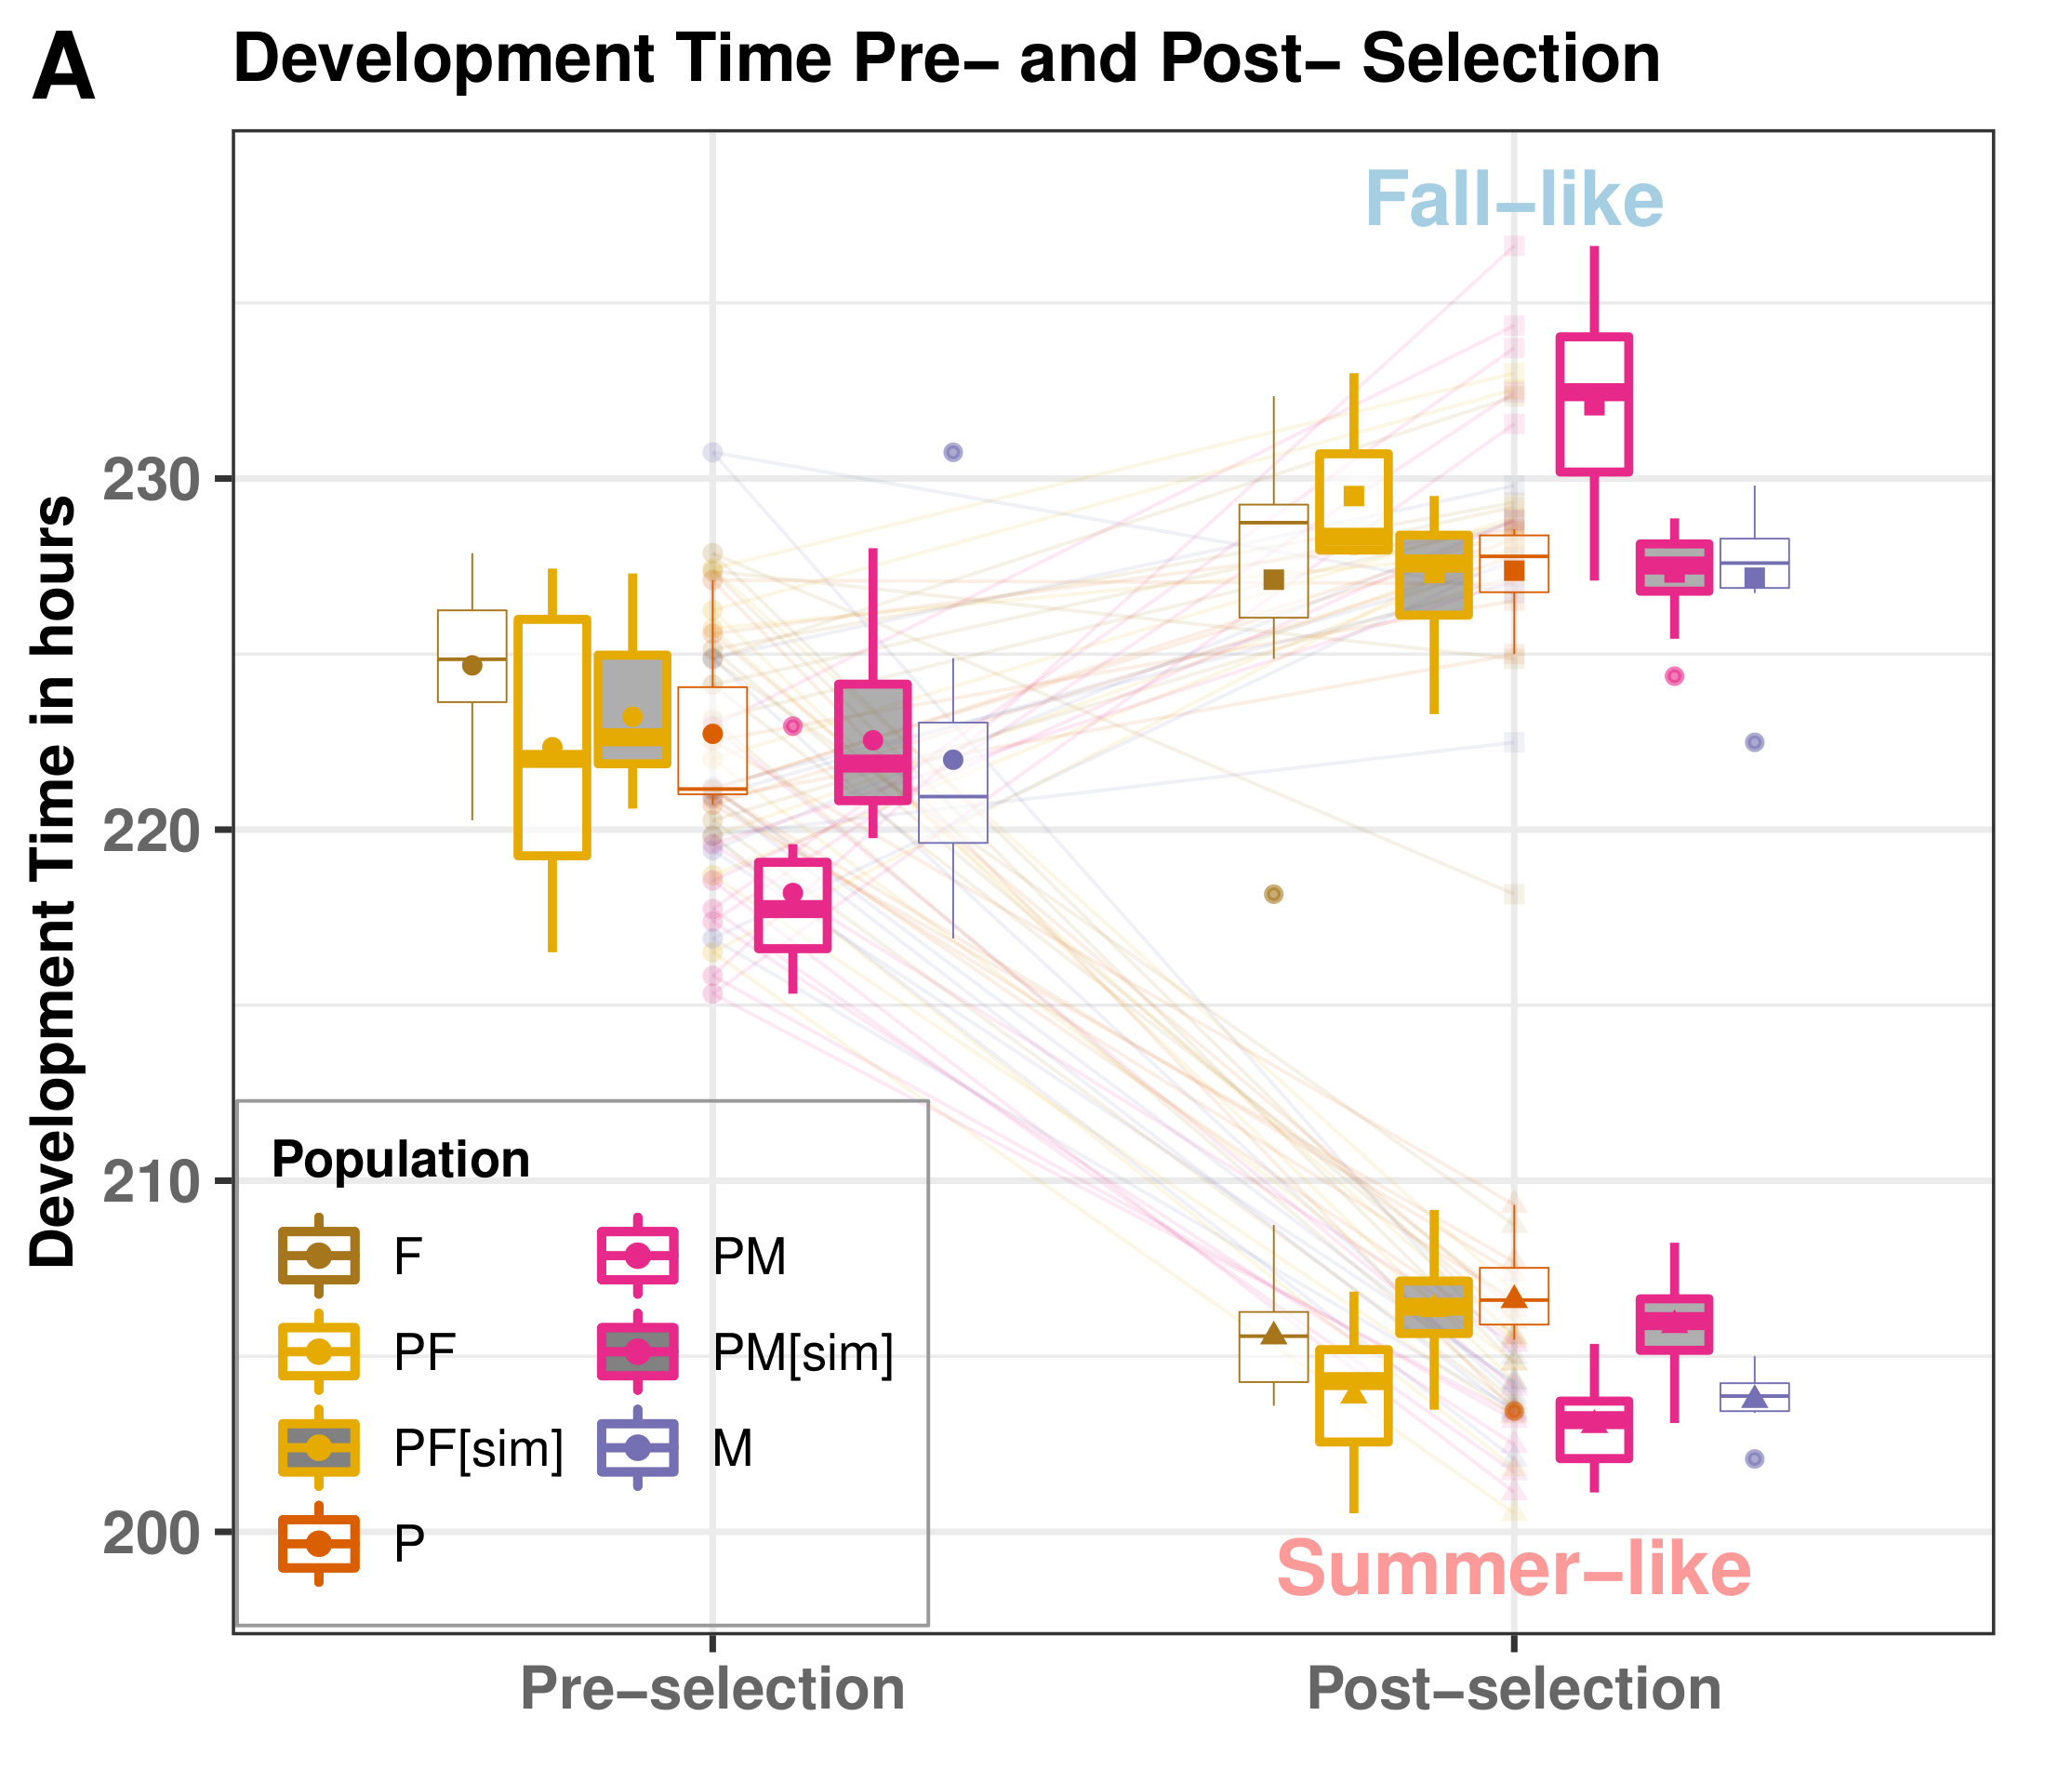
Results: Rapid Adaptation
| Trait | Selection | greater | less |
|---|---|---|---|
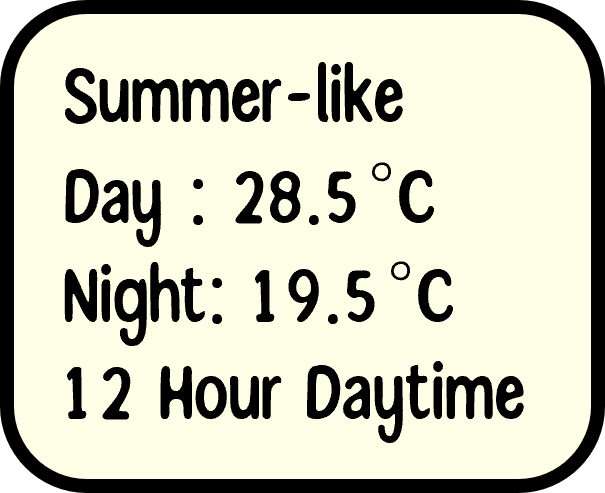
| Development Time | Summer-like | 1.00000 | 0.03125* |
| Development Time | Fall-like | 0.03125* | 1.00000 |
| Viability | Summer-like | 0.03125* | 1.00000 |
| Viability | Fall-like | 0.03125 | 1.00000 |
| Fecundity | Summer-like | 1.00000 | 0.03125* |
| Fecundity | Fall-like | 0.96875 | 0.06250 |
| Heat Tolerance (Females) | Summer-like | 1.00000 | 0.03125* |
| Heat Tolerance (Females) | Fall-like | 1.00000 | 0.03125* |
| Heat Tolerance (Males) | Summer-like | 1.00000 | 0.03125* |
| Heat Tolerance (Males) | Fall-like | 1.00000 | 0.03125* |
| Starvation Resistance (Females) | Summer-like | 0.78125 | 0.31250* |
| Starvation Resistance (Females) | Fall-like | 1.00000 | 0.03125* |
| Starvation Resistance (Males) | Summer-like | 0.90625 | 0.15625 |
| Starvation Resistance (Males) | Fall-like | 0.93750 | 0.09375 |
| Trait | greater | less |
|---|---|---|
| Development Time | 0.03125* | 1.00000 |
| Viability | 0.78125 | 0.31250 |
| Fecundity | 0.03125* | 1.00000 |
| Heat Tolerance (Females) | 0.93750 | 0.09375 |
| Heat Tolerance (Males) | 0.03125* | 1.00000 |
| Starvation Resistance (Females) | 1.00000 | 0.03125* |
| Starvation Resistance (Males) | 0.40625 | 0.68750 |
Results: Rapid Adaptation
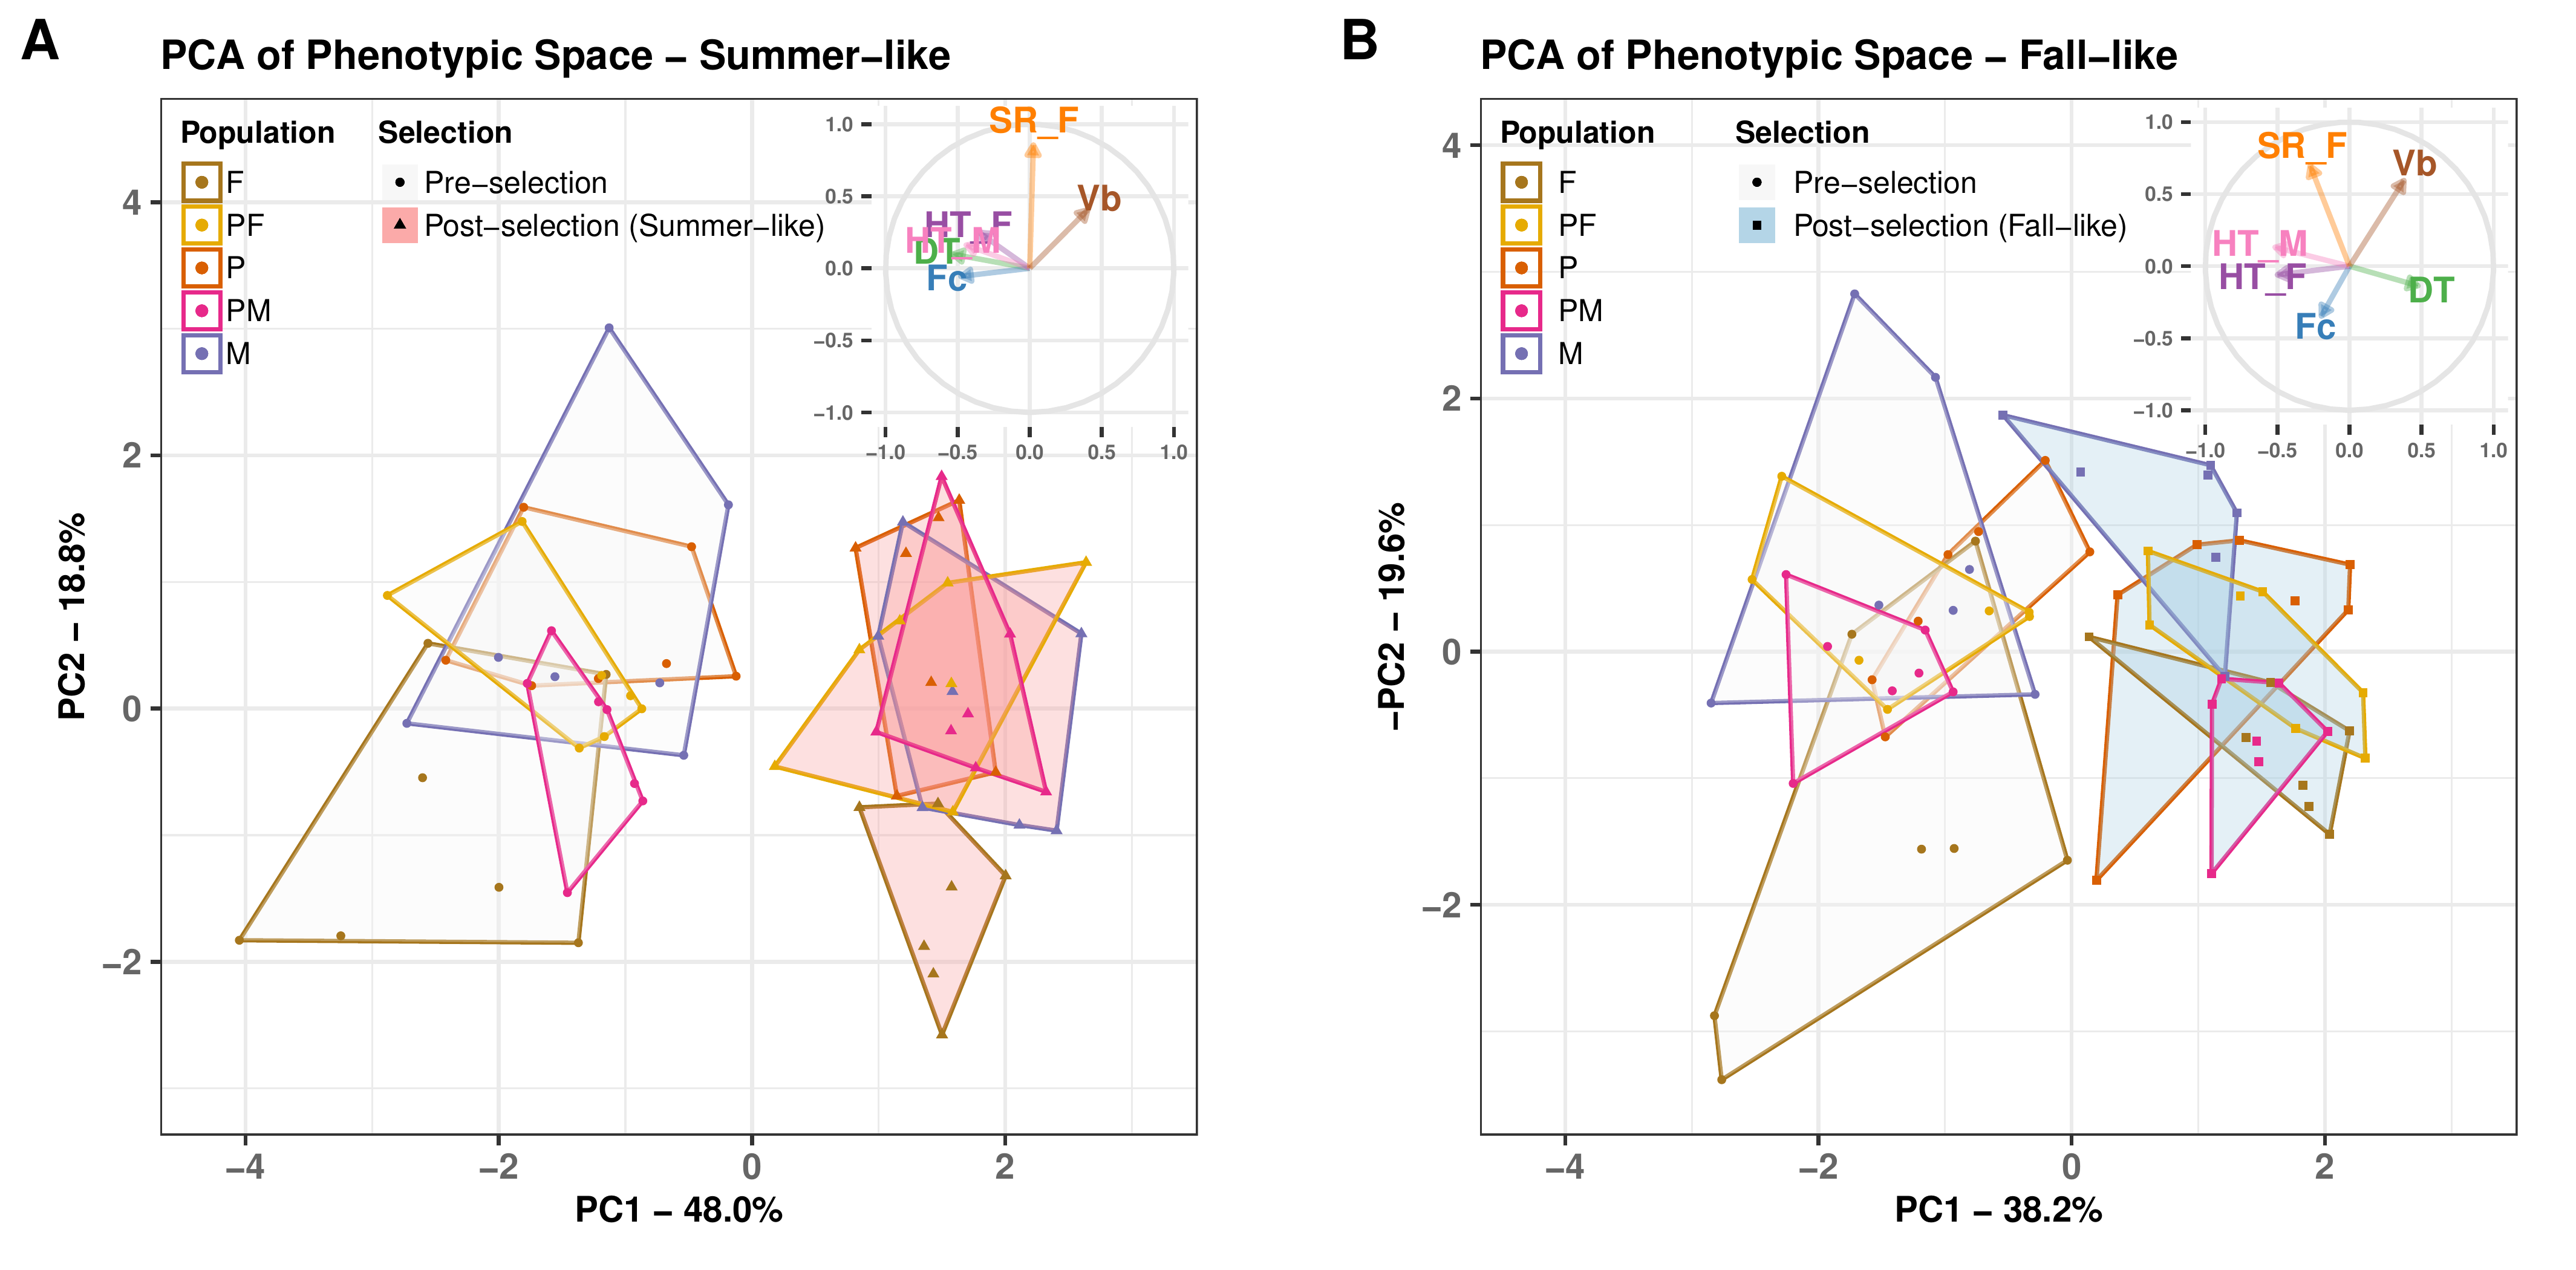
Results: Temperature-mediated adaptation
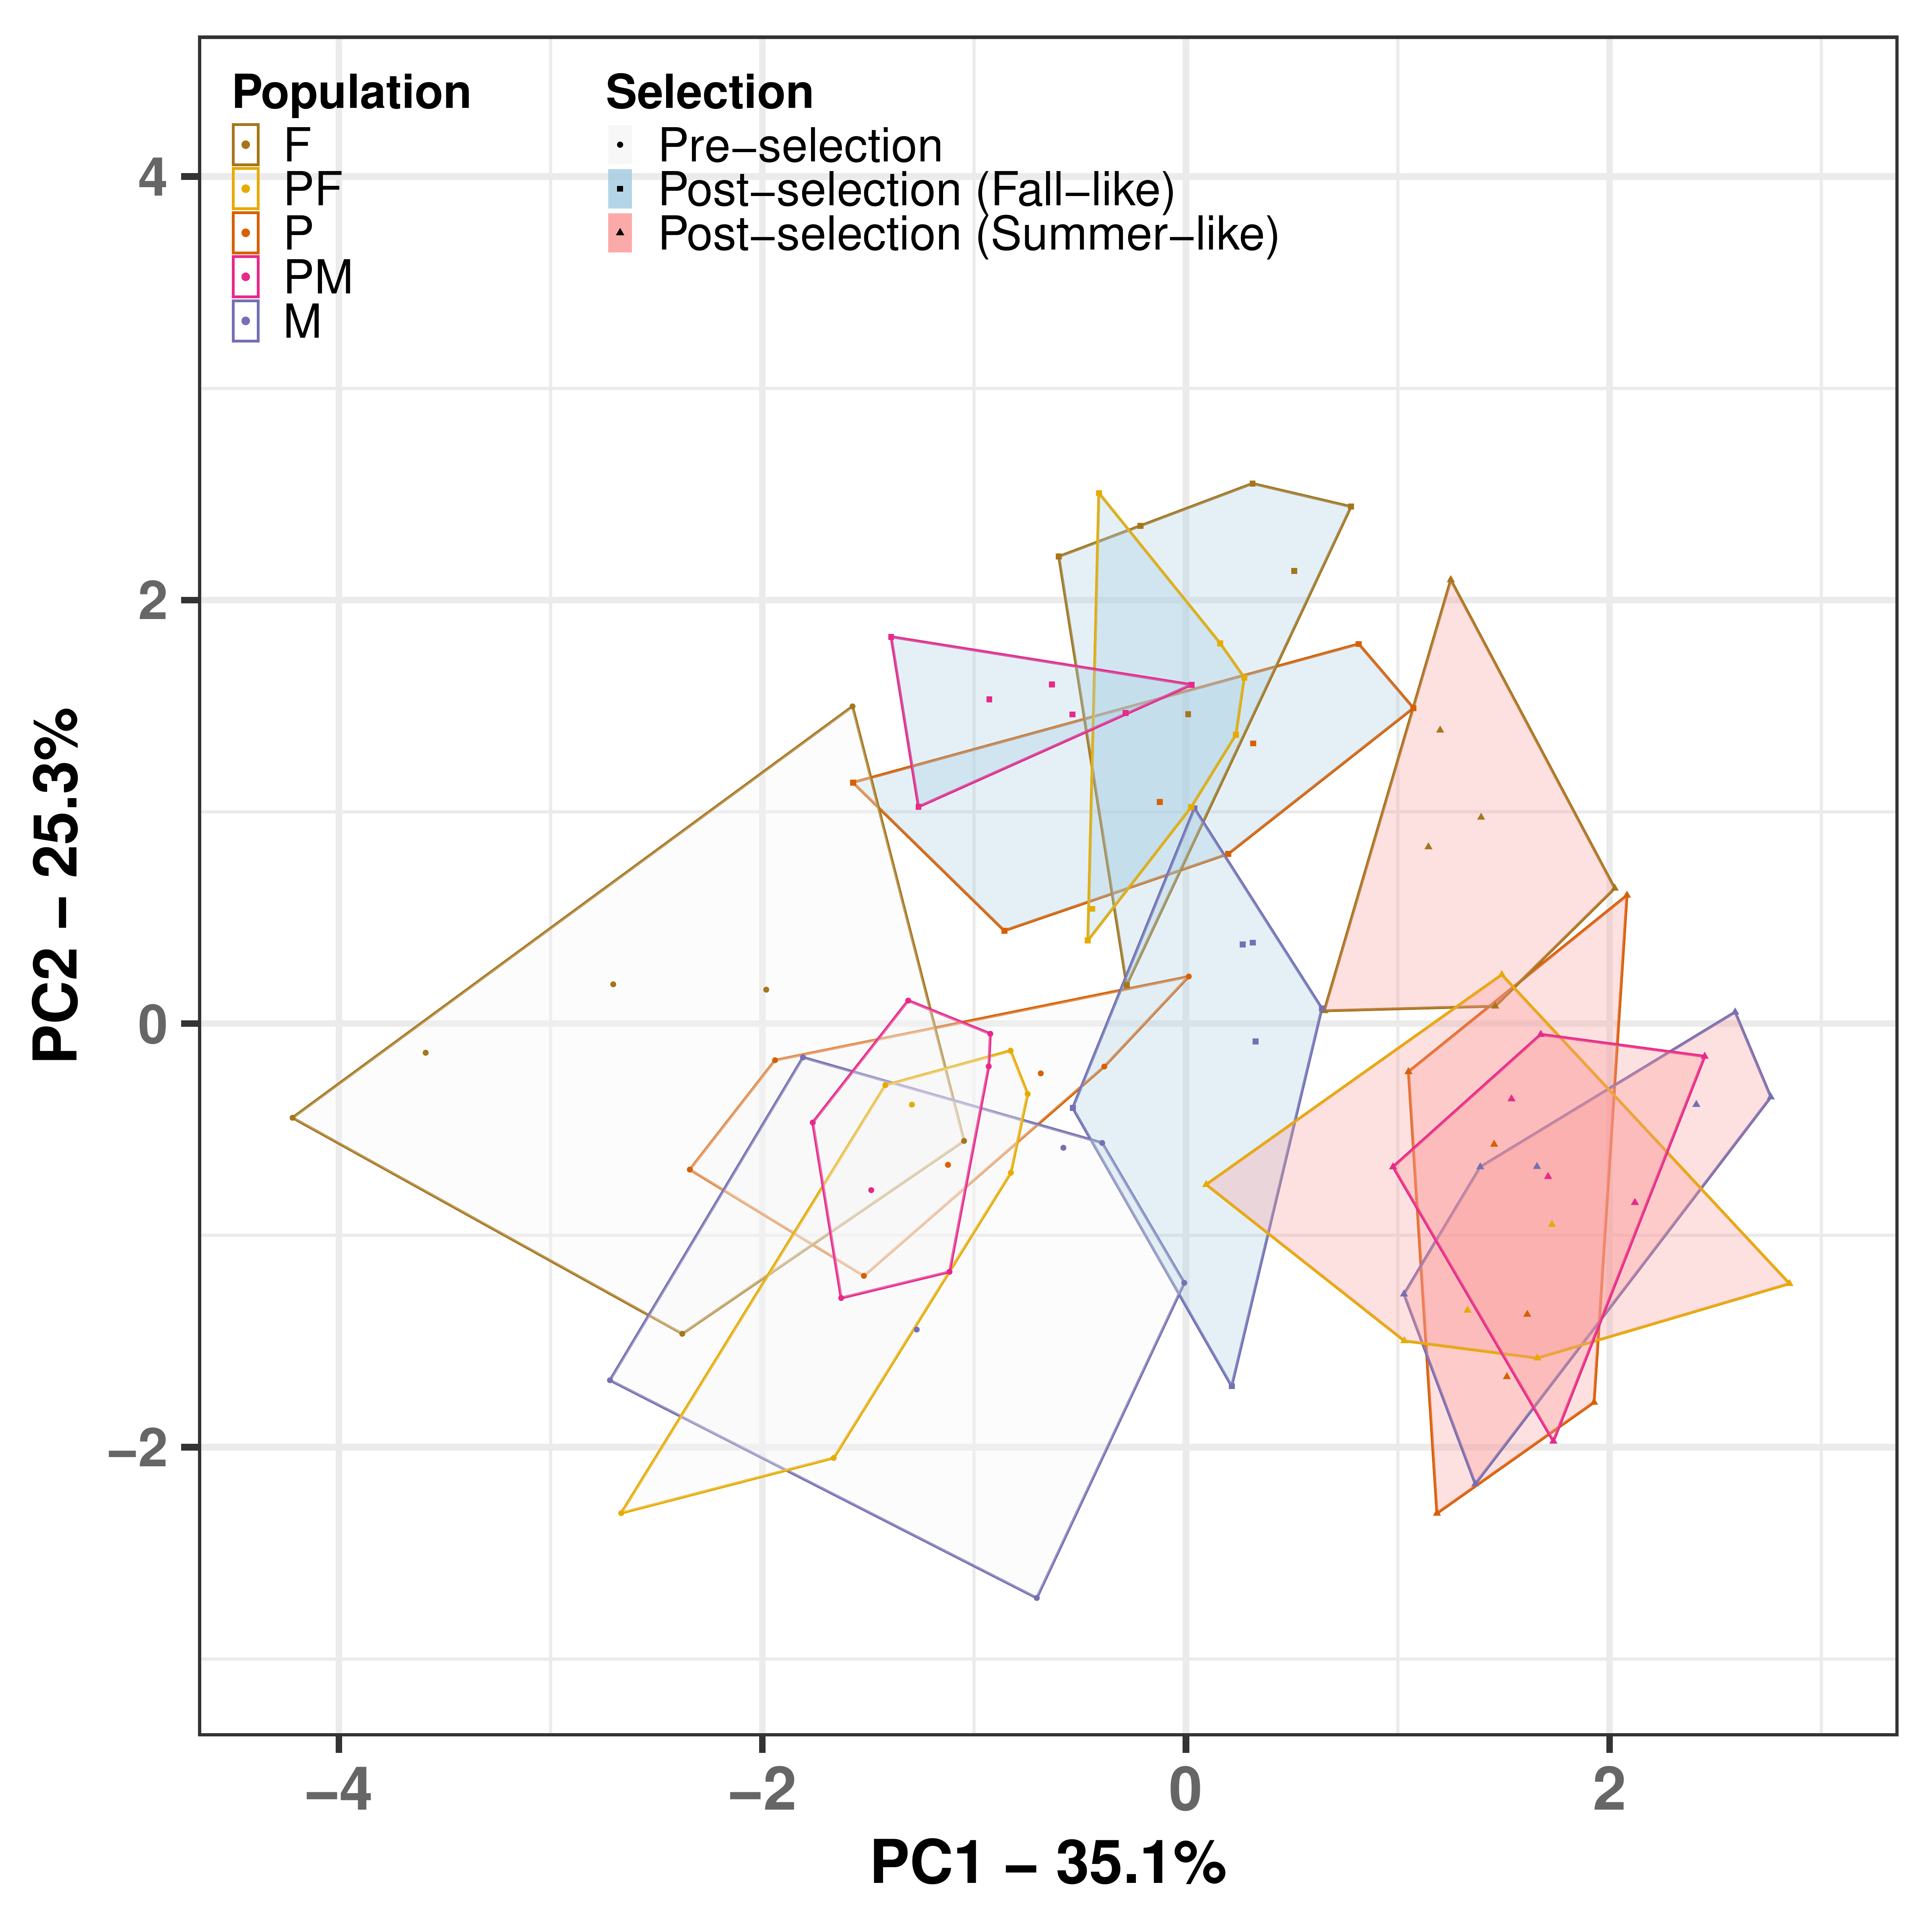
| Df | Pillai | approx F | num Df | den Df | Pr(>F) | |
|---|---|---|---|---|---|---|
| Selection | 1 | 0.853 | 111.454 | 6 | 115 | 1.52e-45 *** |
| Time | 1 | 0.782 | 68.814 | 6 | 115 | 9.45e-36 *** |
| Population | 4 | 0.831 | 5.160 | 24 | 472 | 2.08e-13 *** |
| Selection:Time | 1 | 0.853 | 111.454 | 6 | 115 | 1.52e-45 *** |
| Selection:Population | 4 | 0.175 | 0.901 | 24 | 472 | 6.01e-01 |
| Time:Population | 4 | 0.430 | 2.367 | 24 | 472 | 3.26e-04 *** |
| Selection:Time:Population | 4 | 0.175 | 0.901 | 24 | 472 | 6.01e-01 |
| Residuals | 120 | NA | NA | NA | NA | NA |
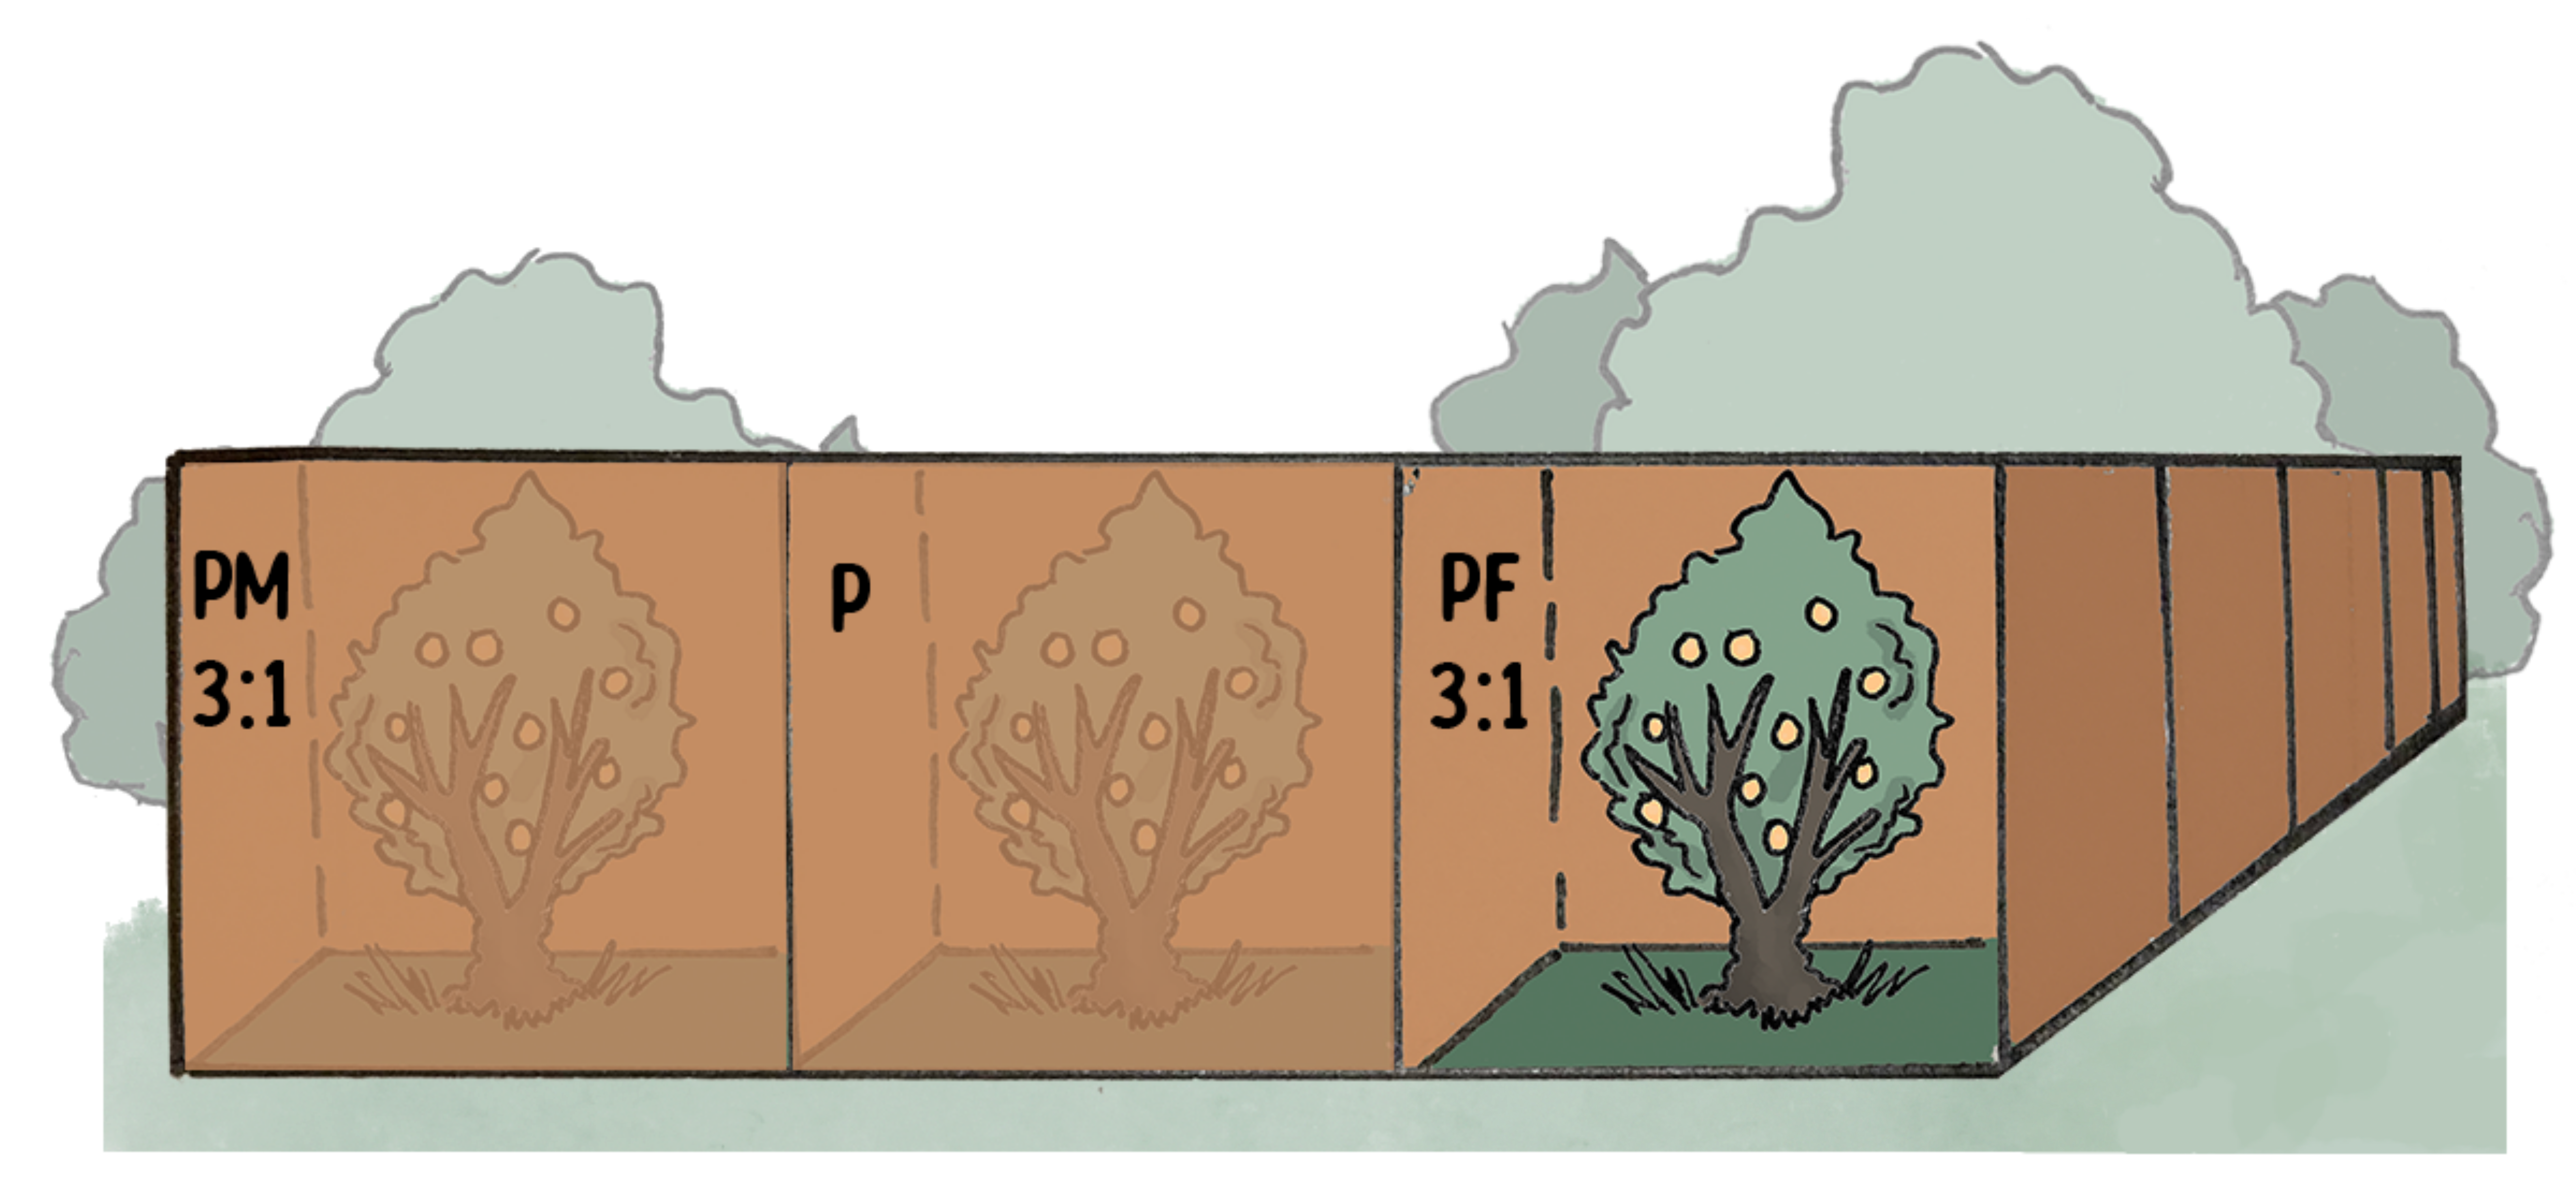
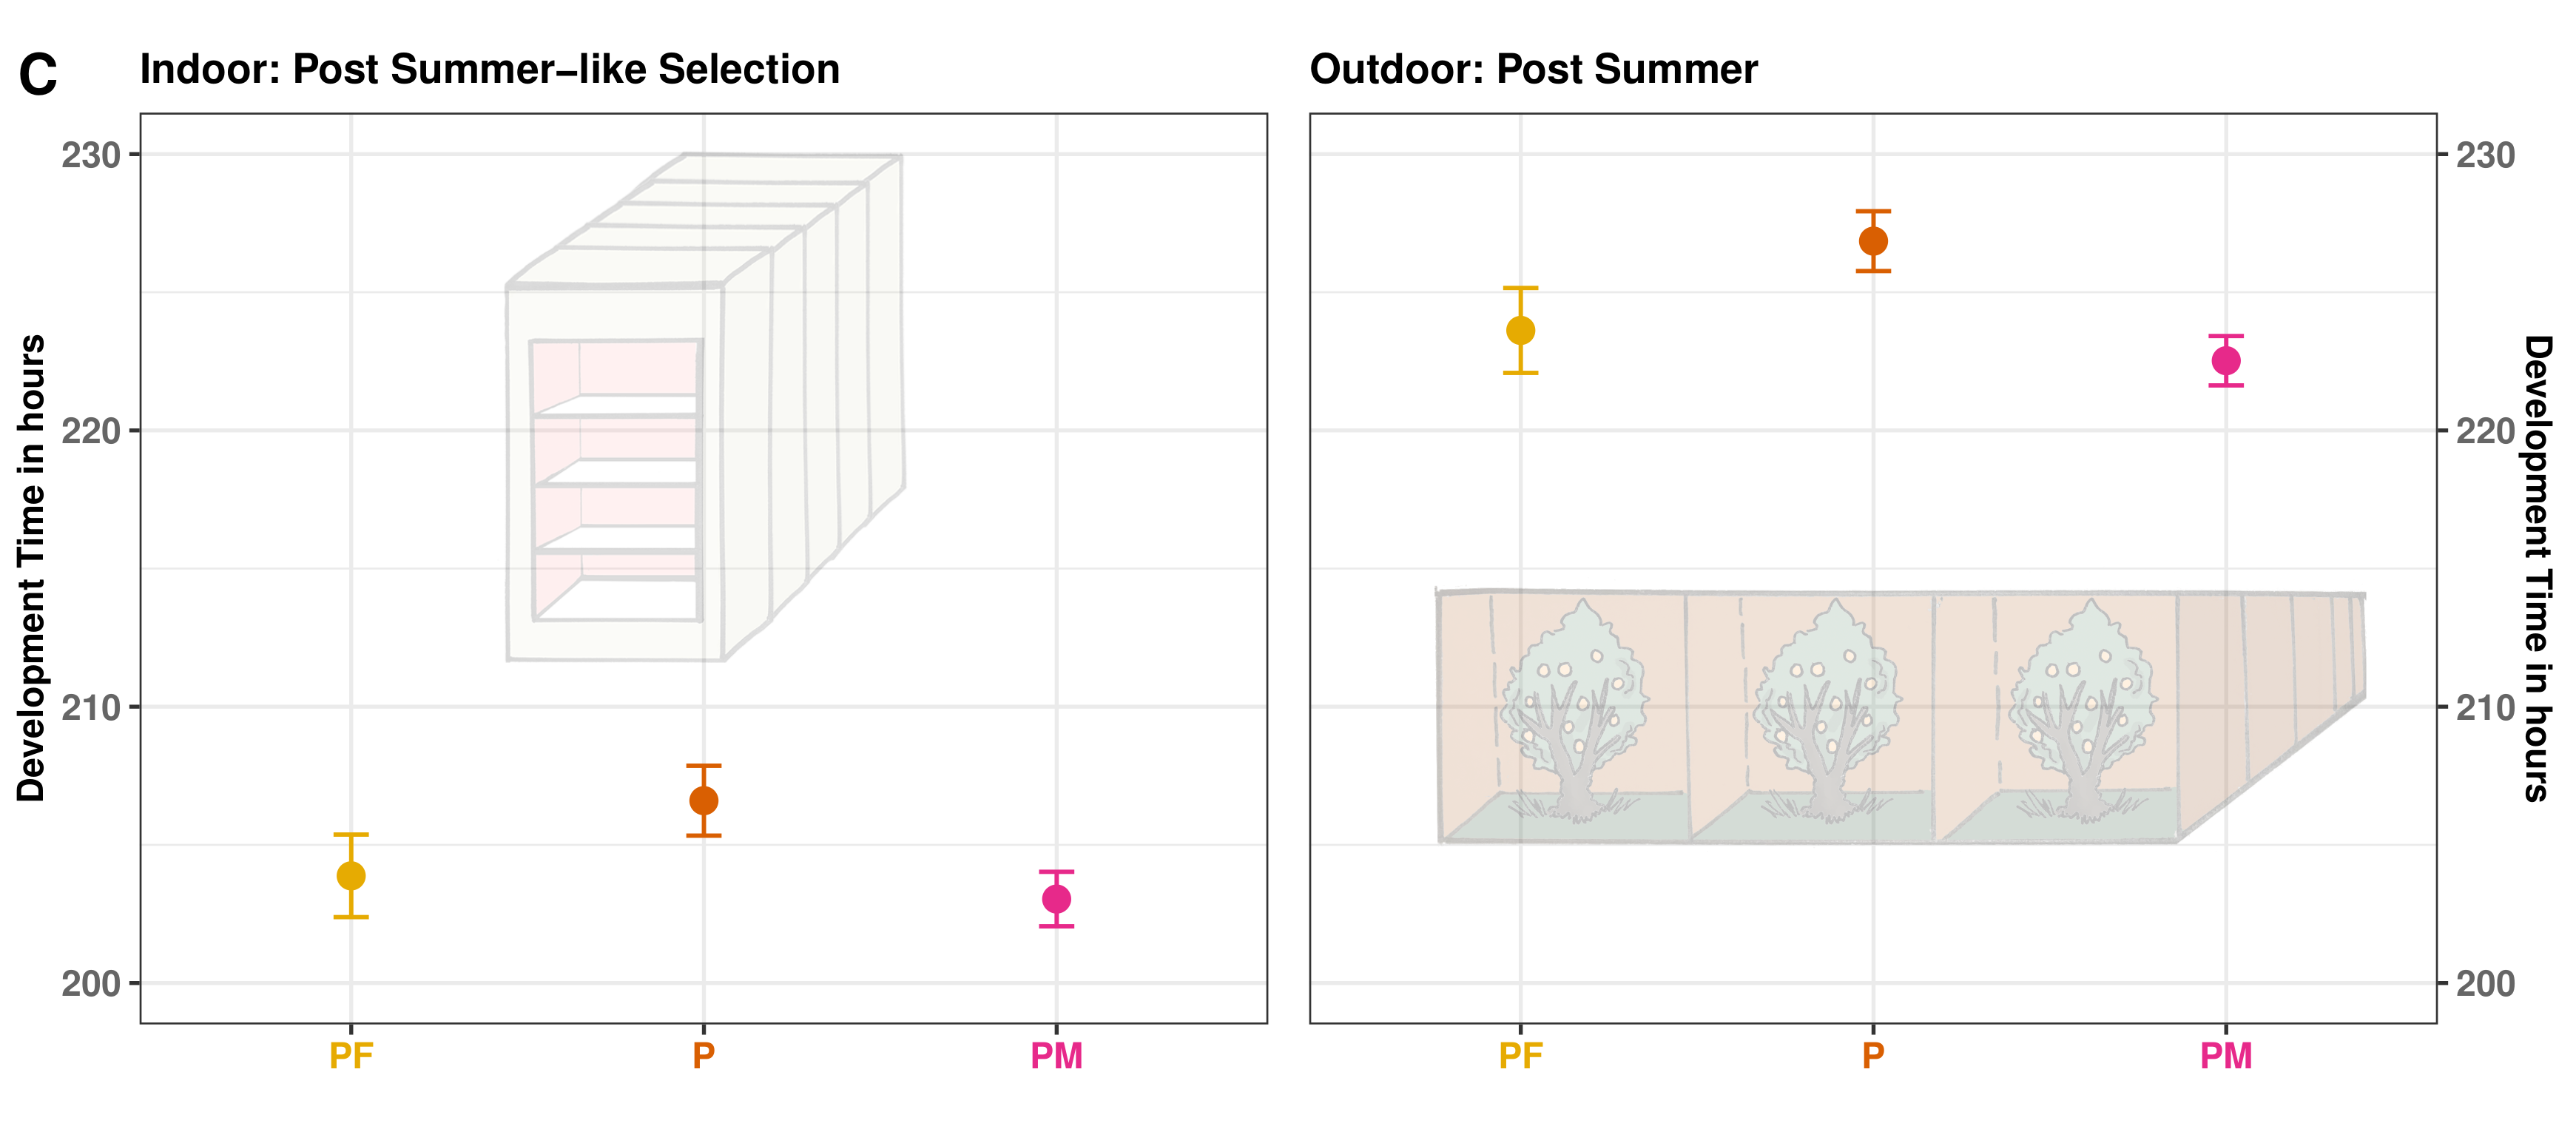
Results: Gene Flow Facilitated Adaptive Response
| Time | Selection | Population | greater | less |
|---|---|---|---|---|
| Pre-selection | PF vs PF[sim] | 0.69514 | 0.304863 | |
| Pre-selection | PM vs PM[sim] | 0.99832 | 0.001681** | |
| Post-selection | Summer-like | PF vs PF[sim] | 0.98807 | 0.011932* |
| Post-selection | Summer-like | PM vs PM[sim] | 0.99933 | 0.000671*** |
| Post-selection | Fall-like | PF vs PF[sim] | 0.02150* | 0.978500 |
| Post-selection | Fall-like | PM vs PM[sim] | 0.00416** | 0.995844 |
Results: Lab - Field Palallelism
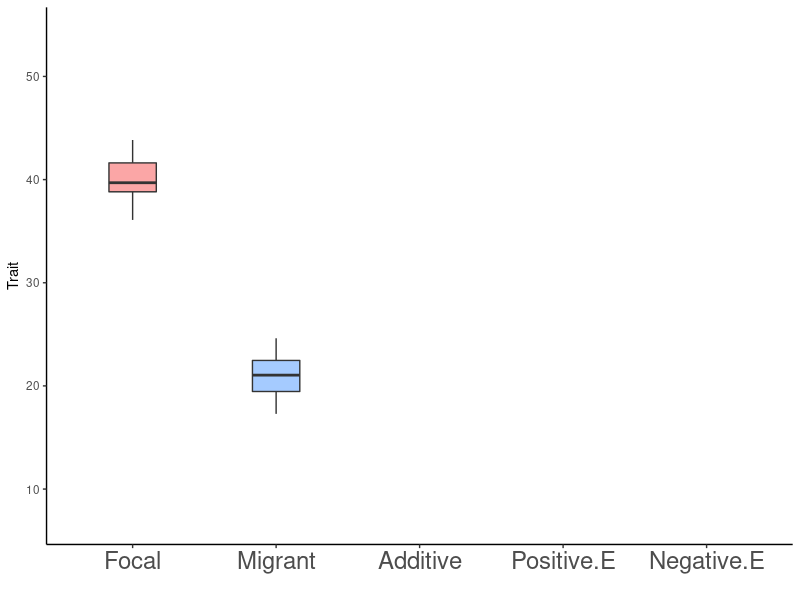
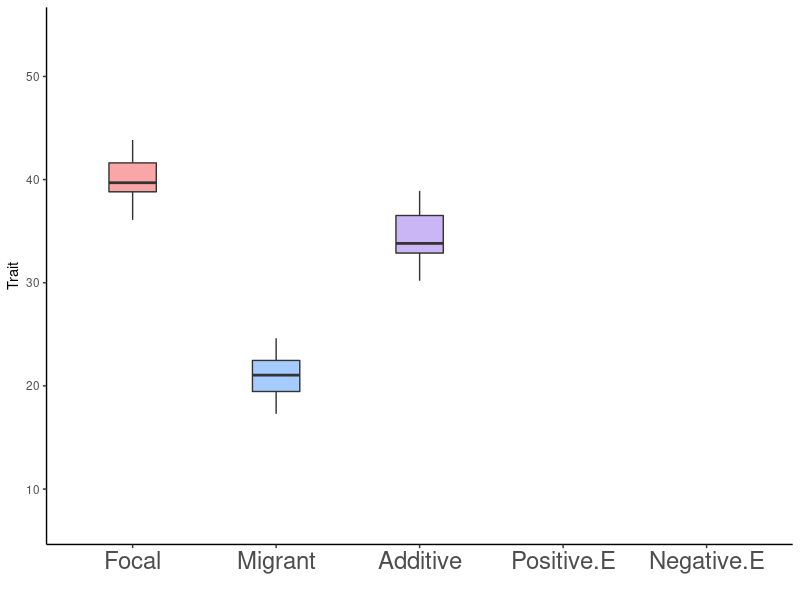
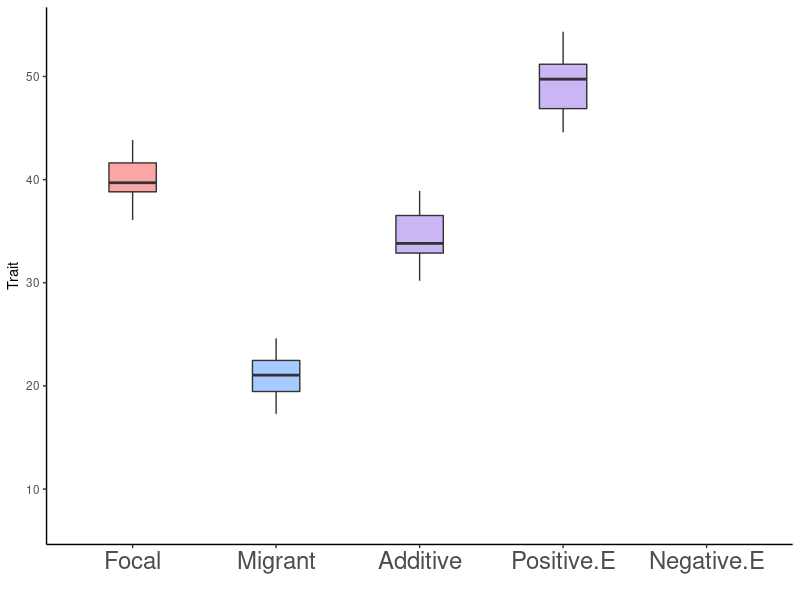
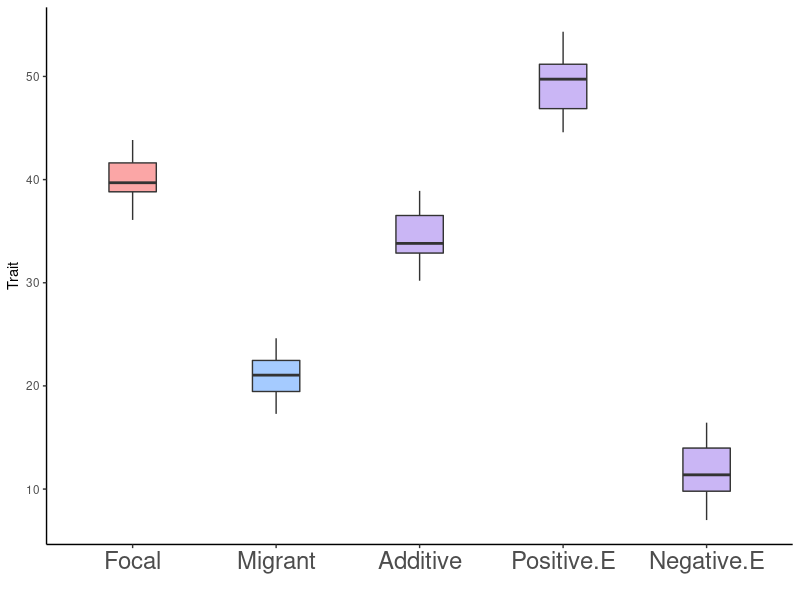
Results: Epistasis
- No effect
- Impedes adaptation
- Facilitates adaptation
- Variation is good regardless of the source (assumes positive epistasis)
- Always increased fitness
- Condition dependent (can be a mix of positive and negative epistasis)
- Decreased fitness followed by increasing fitness after several generations
Design and Method
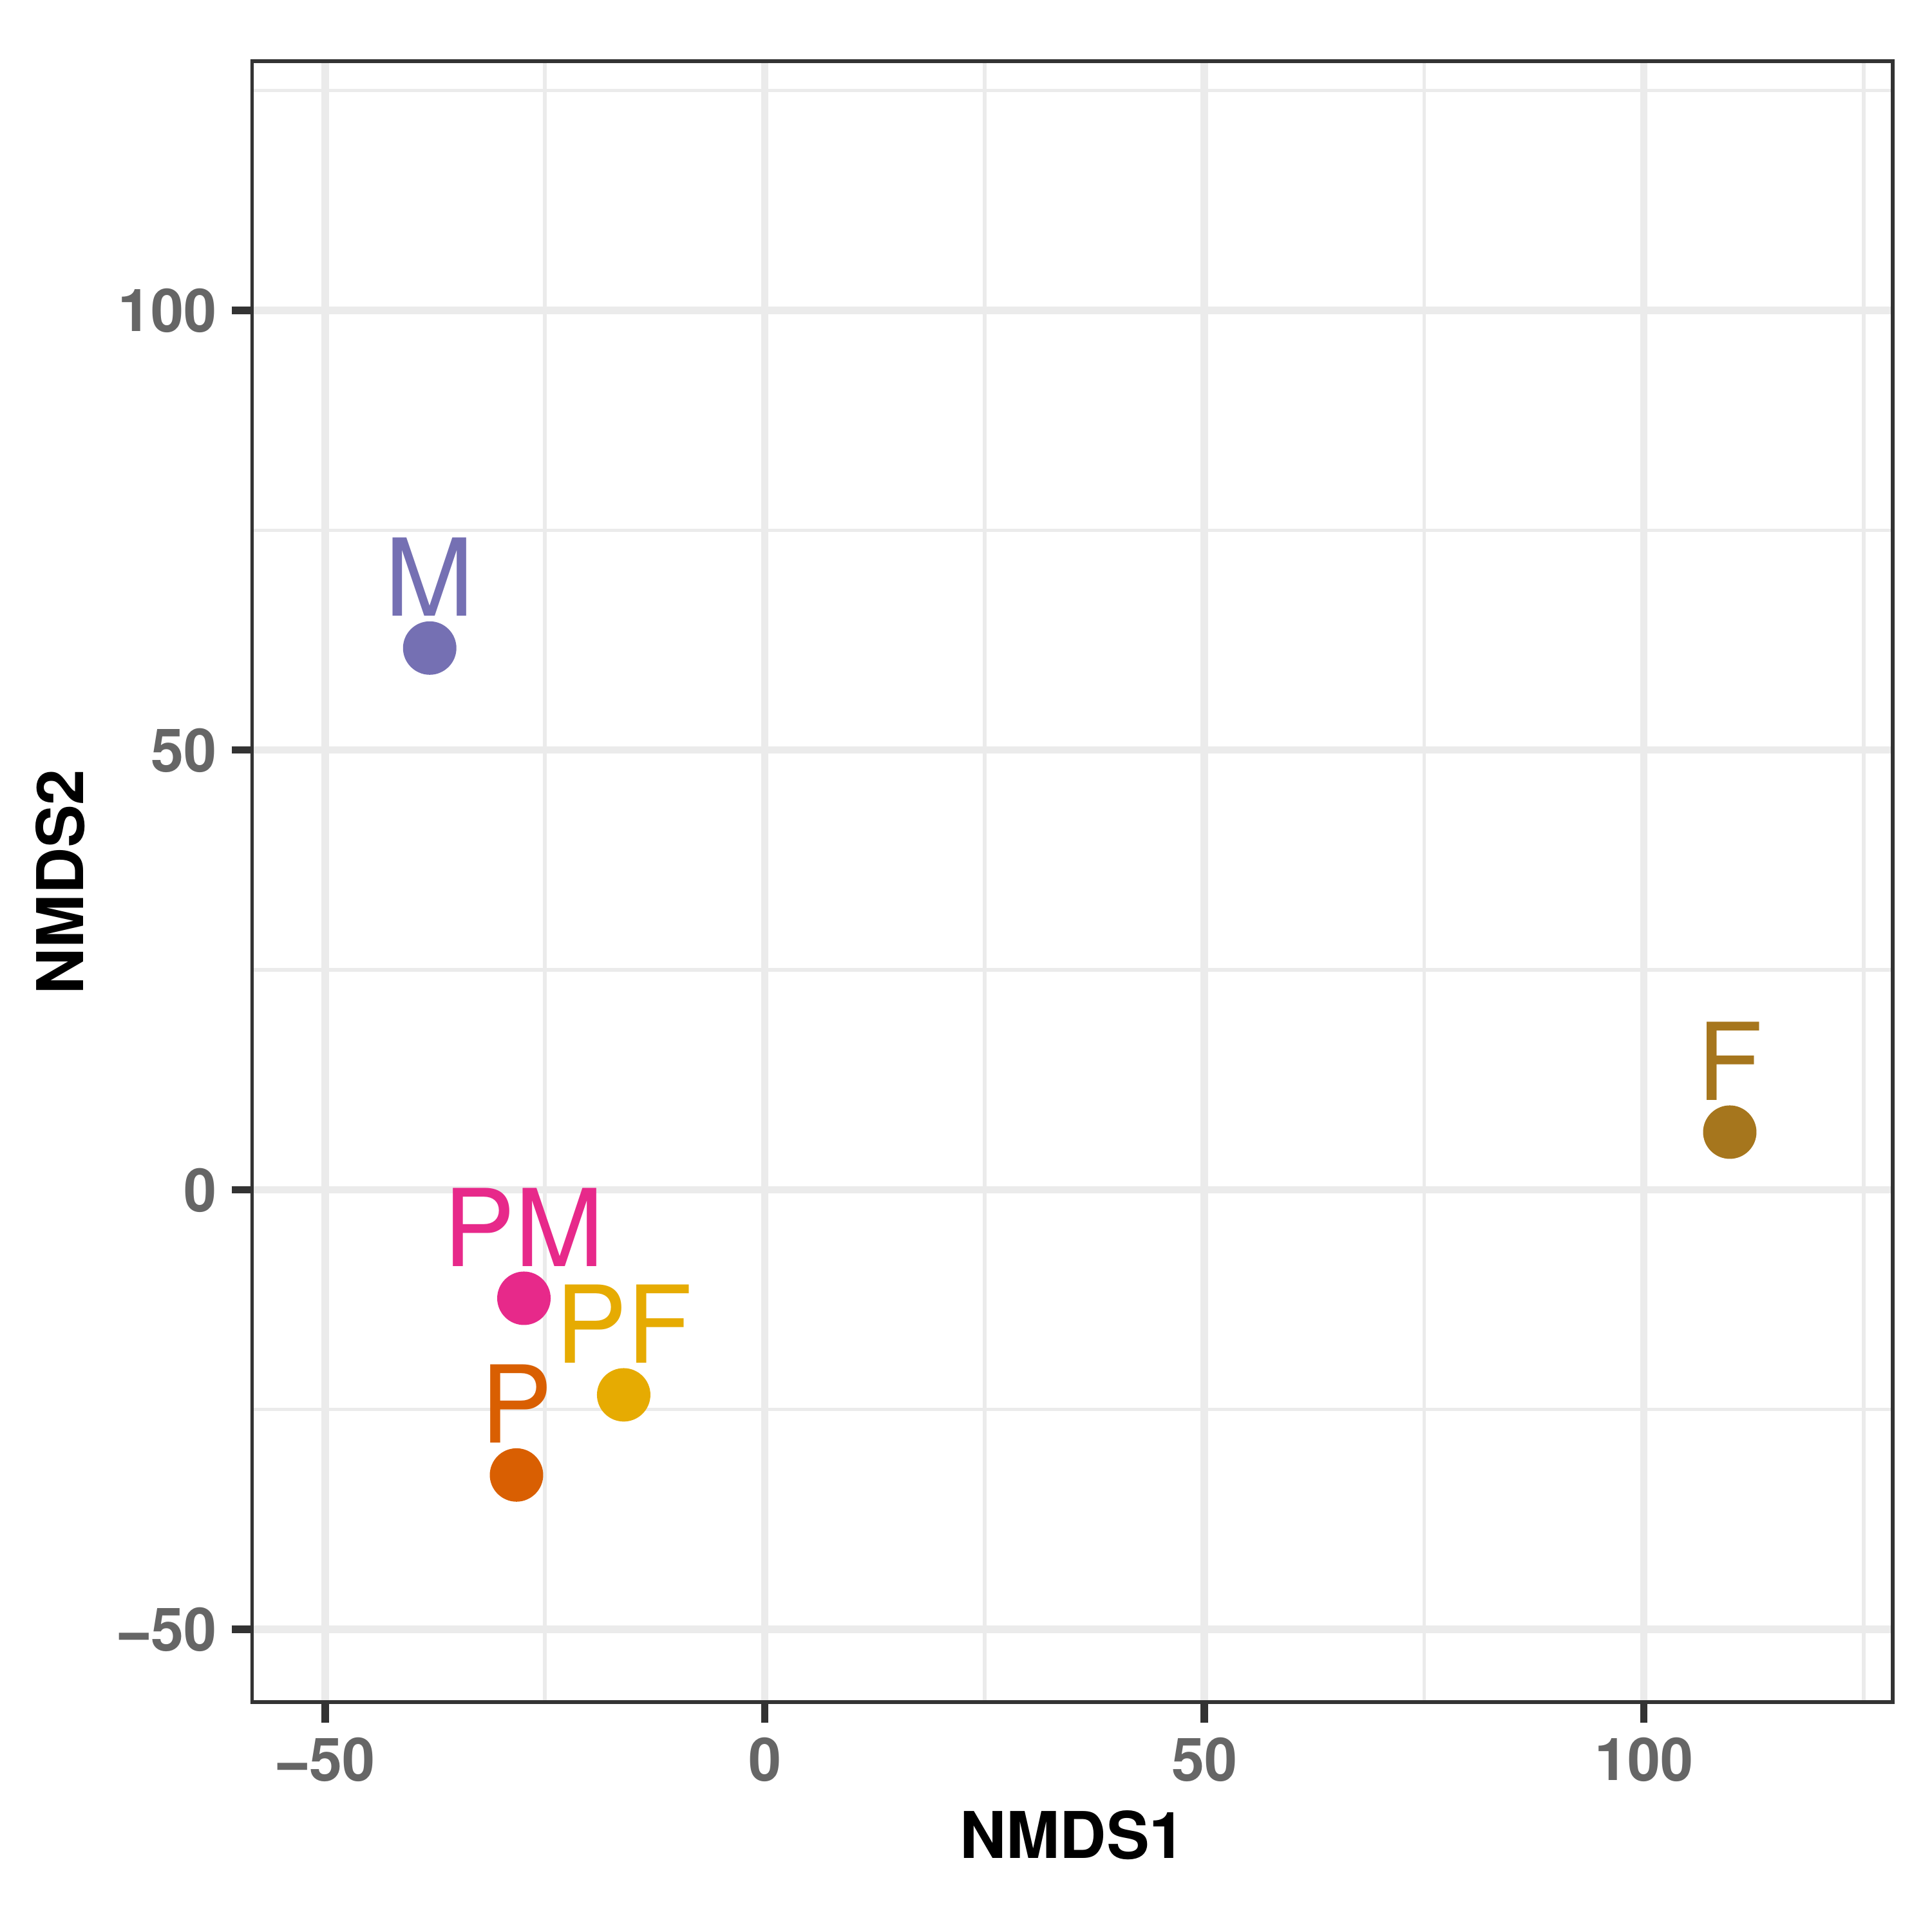
Results: Relatedness
.png)
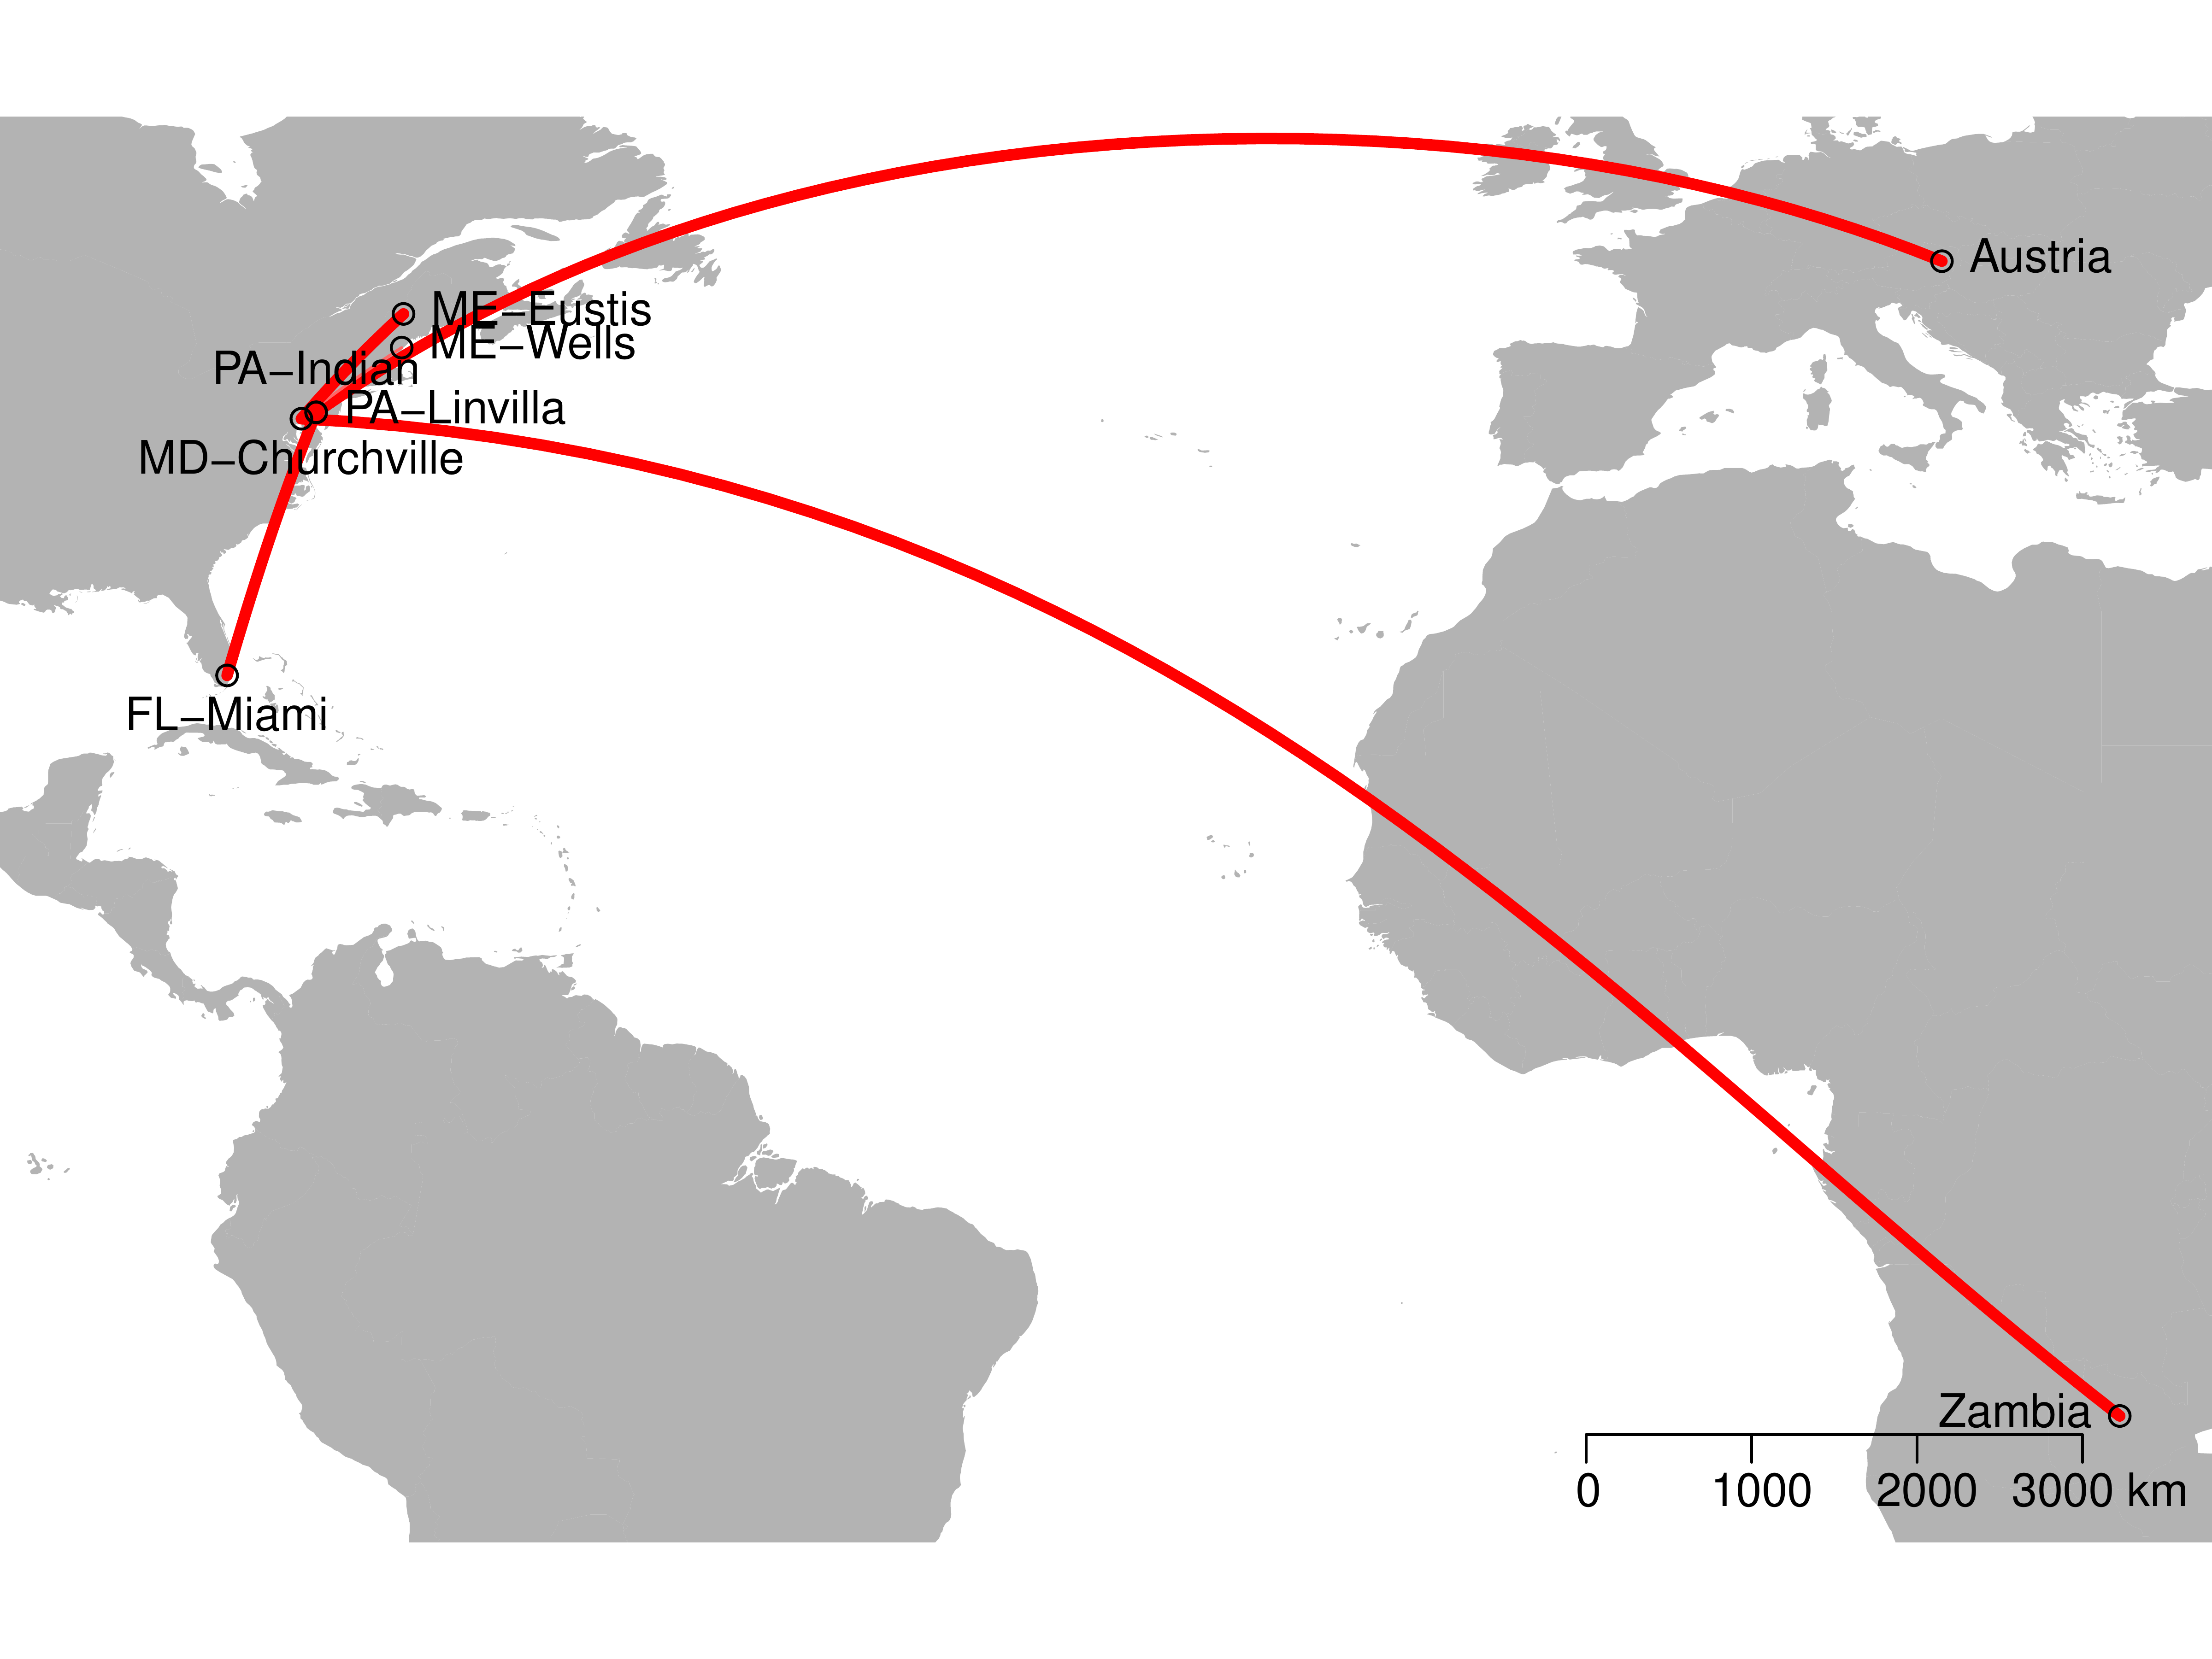
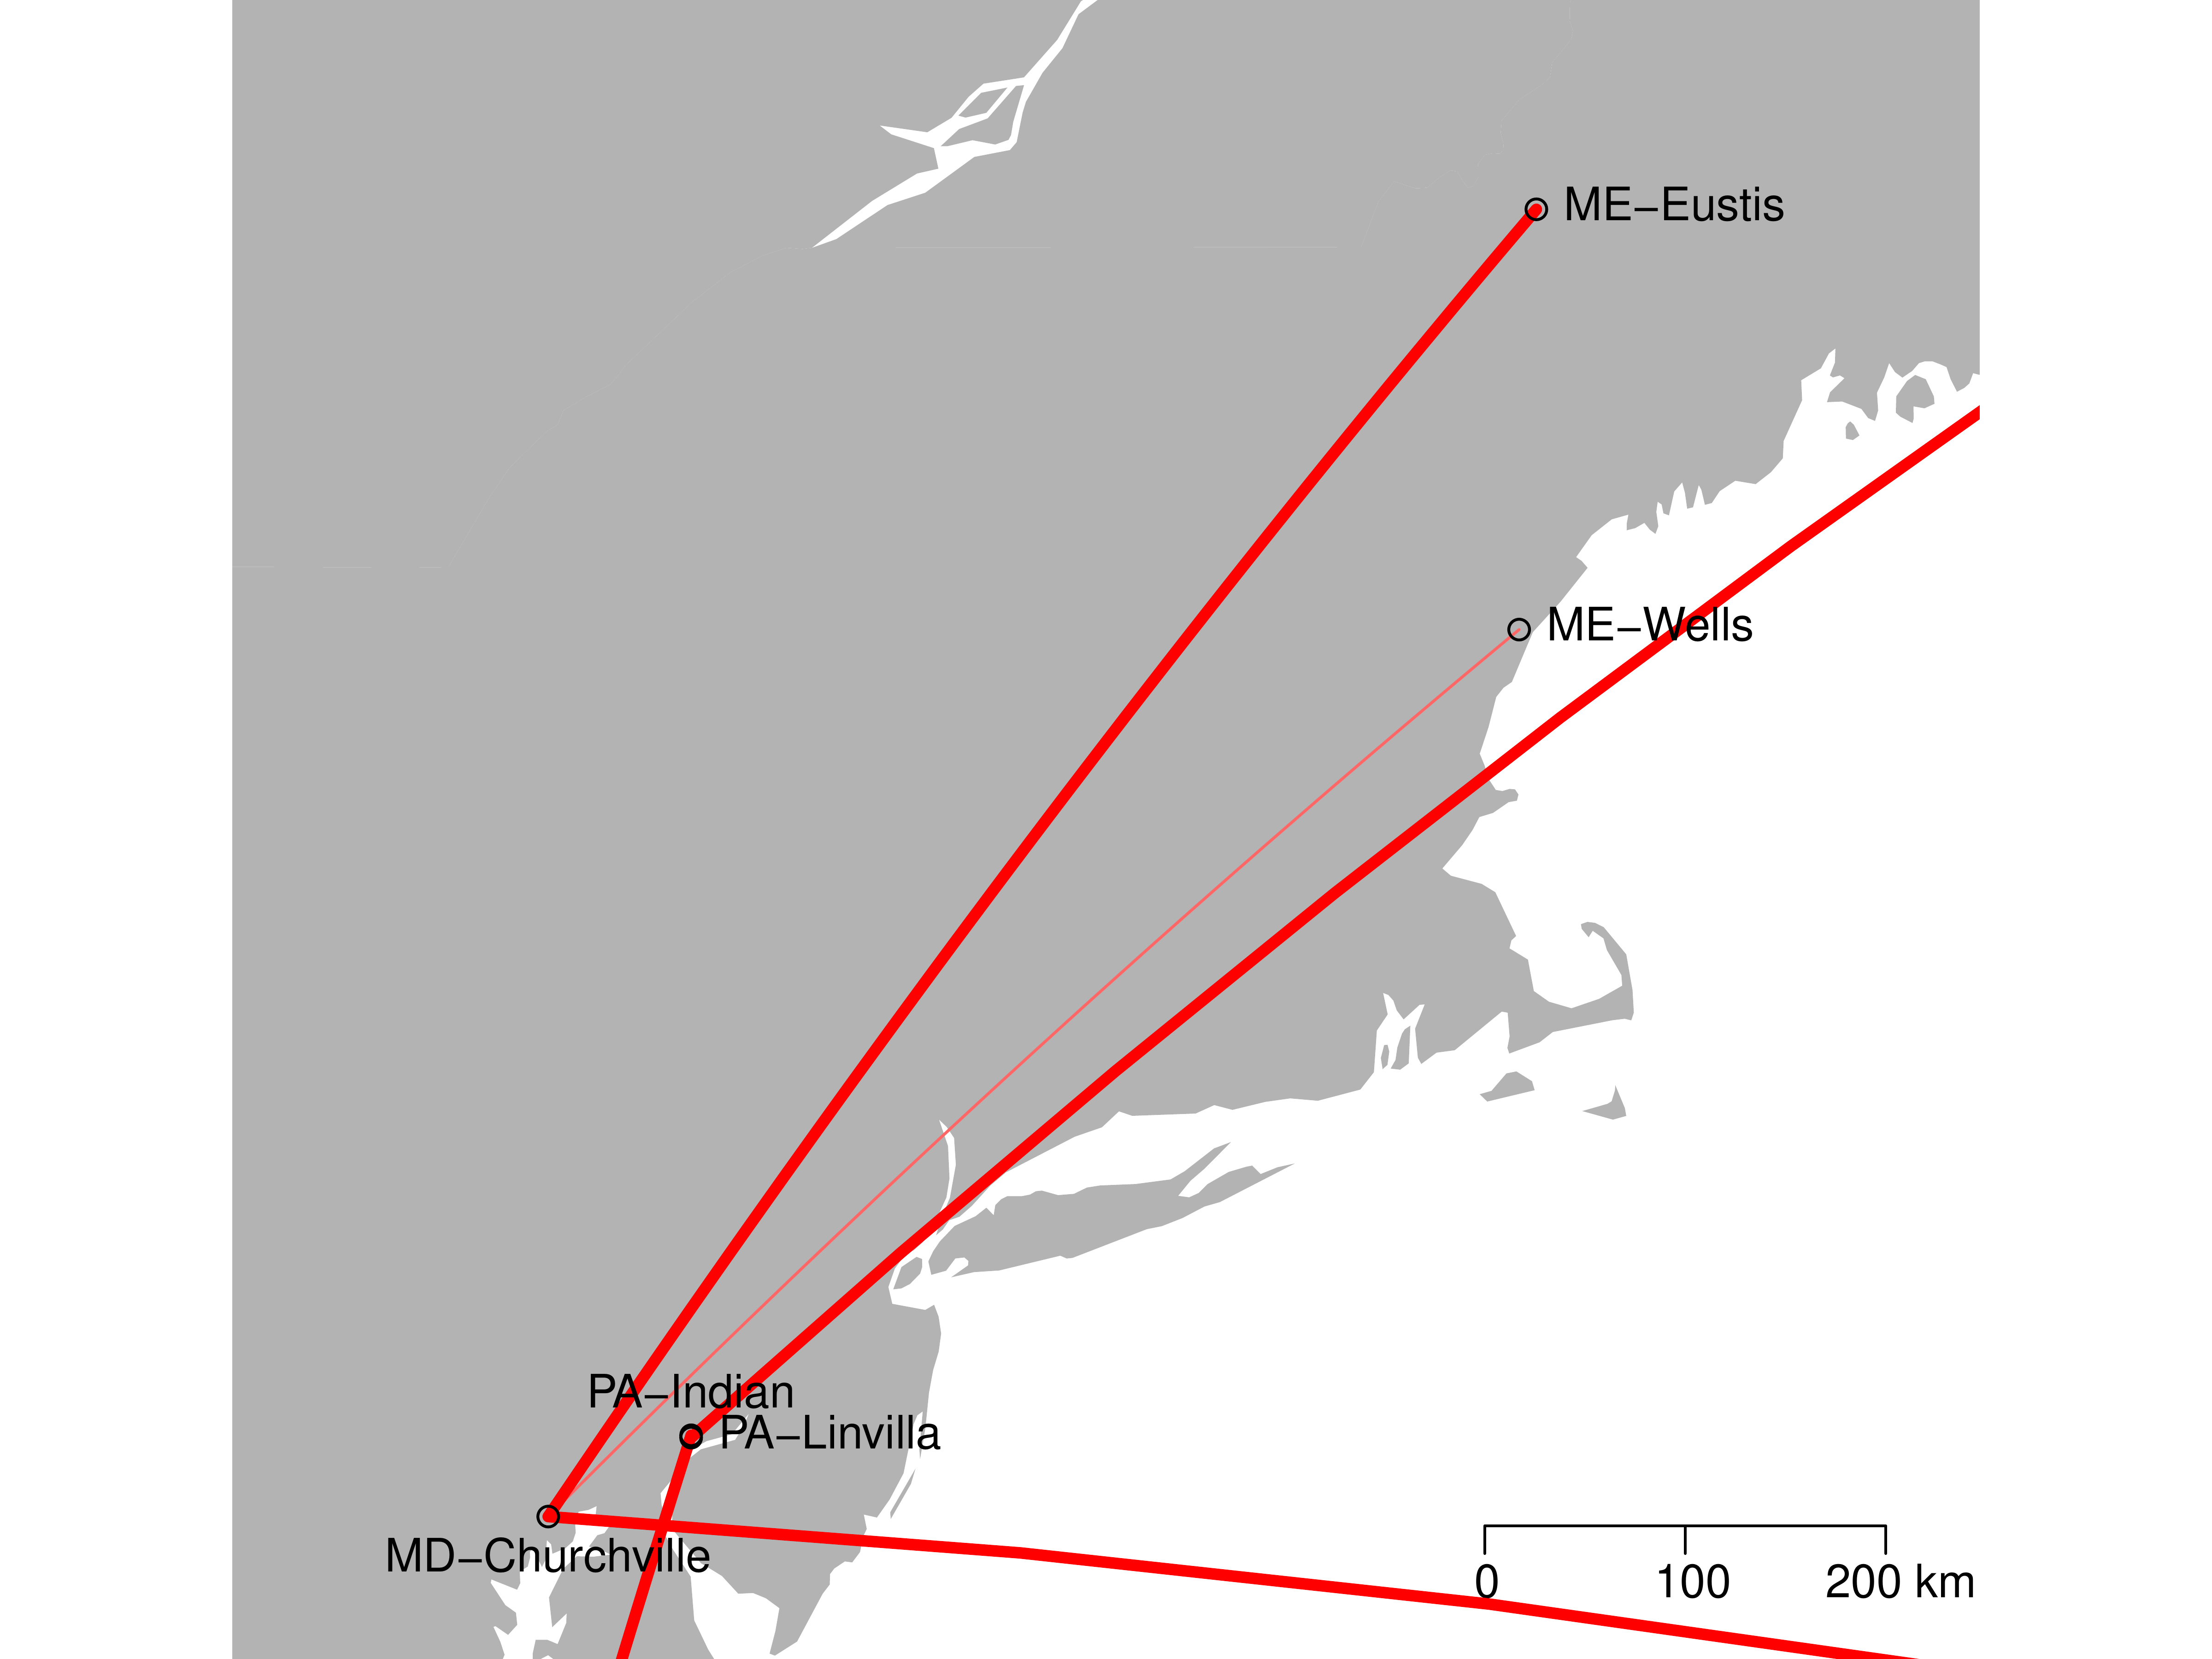
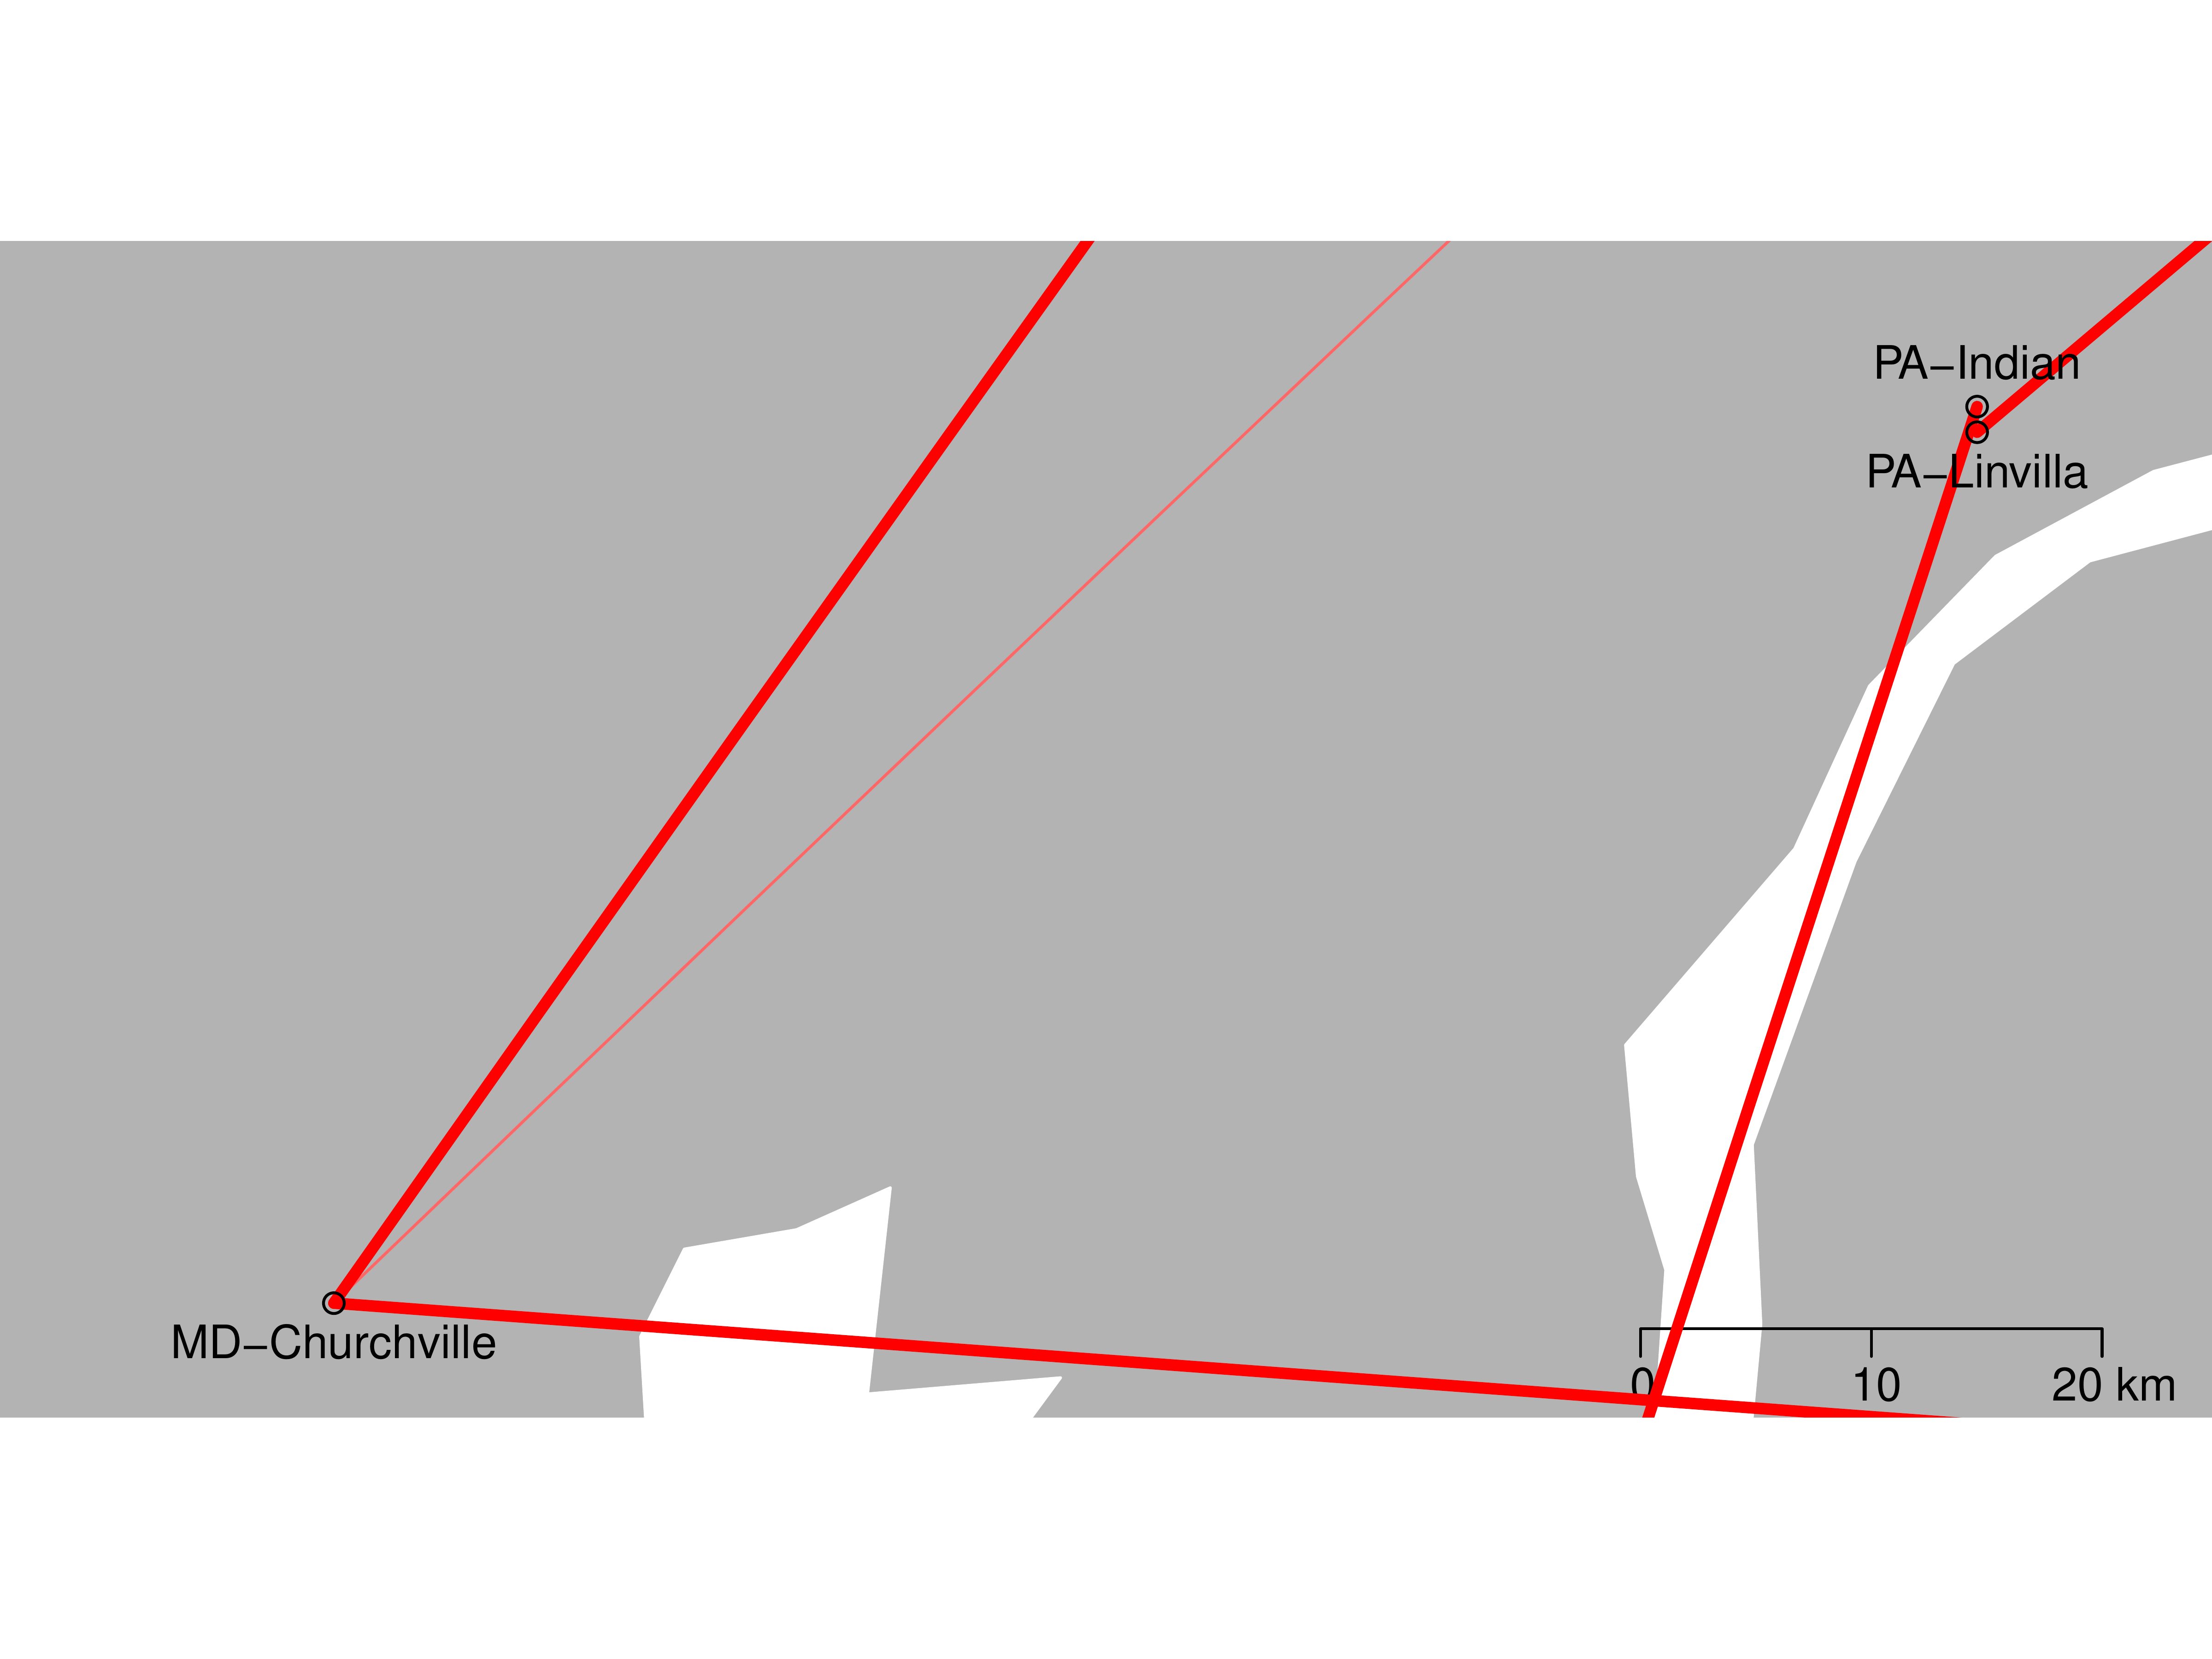
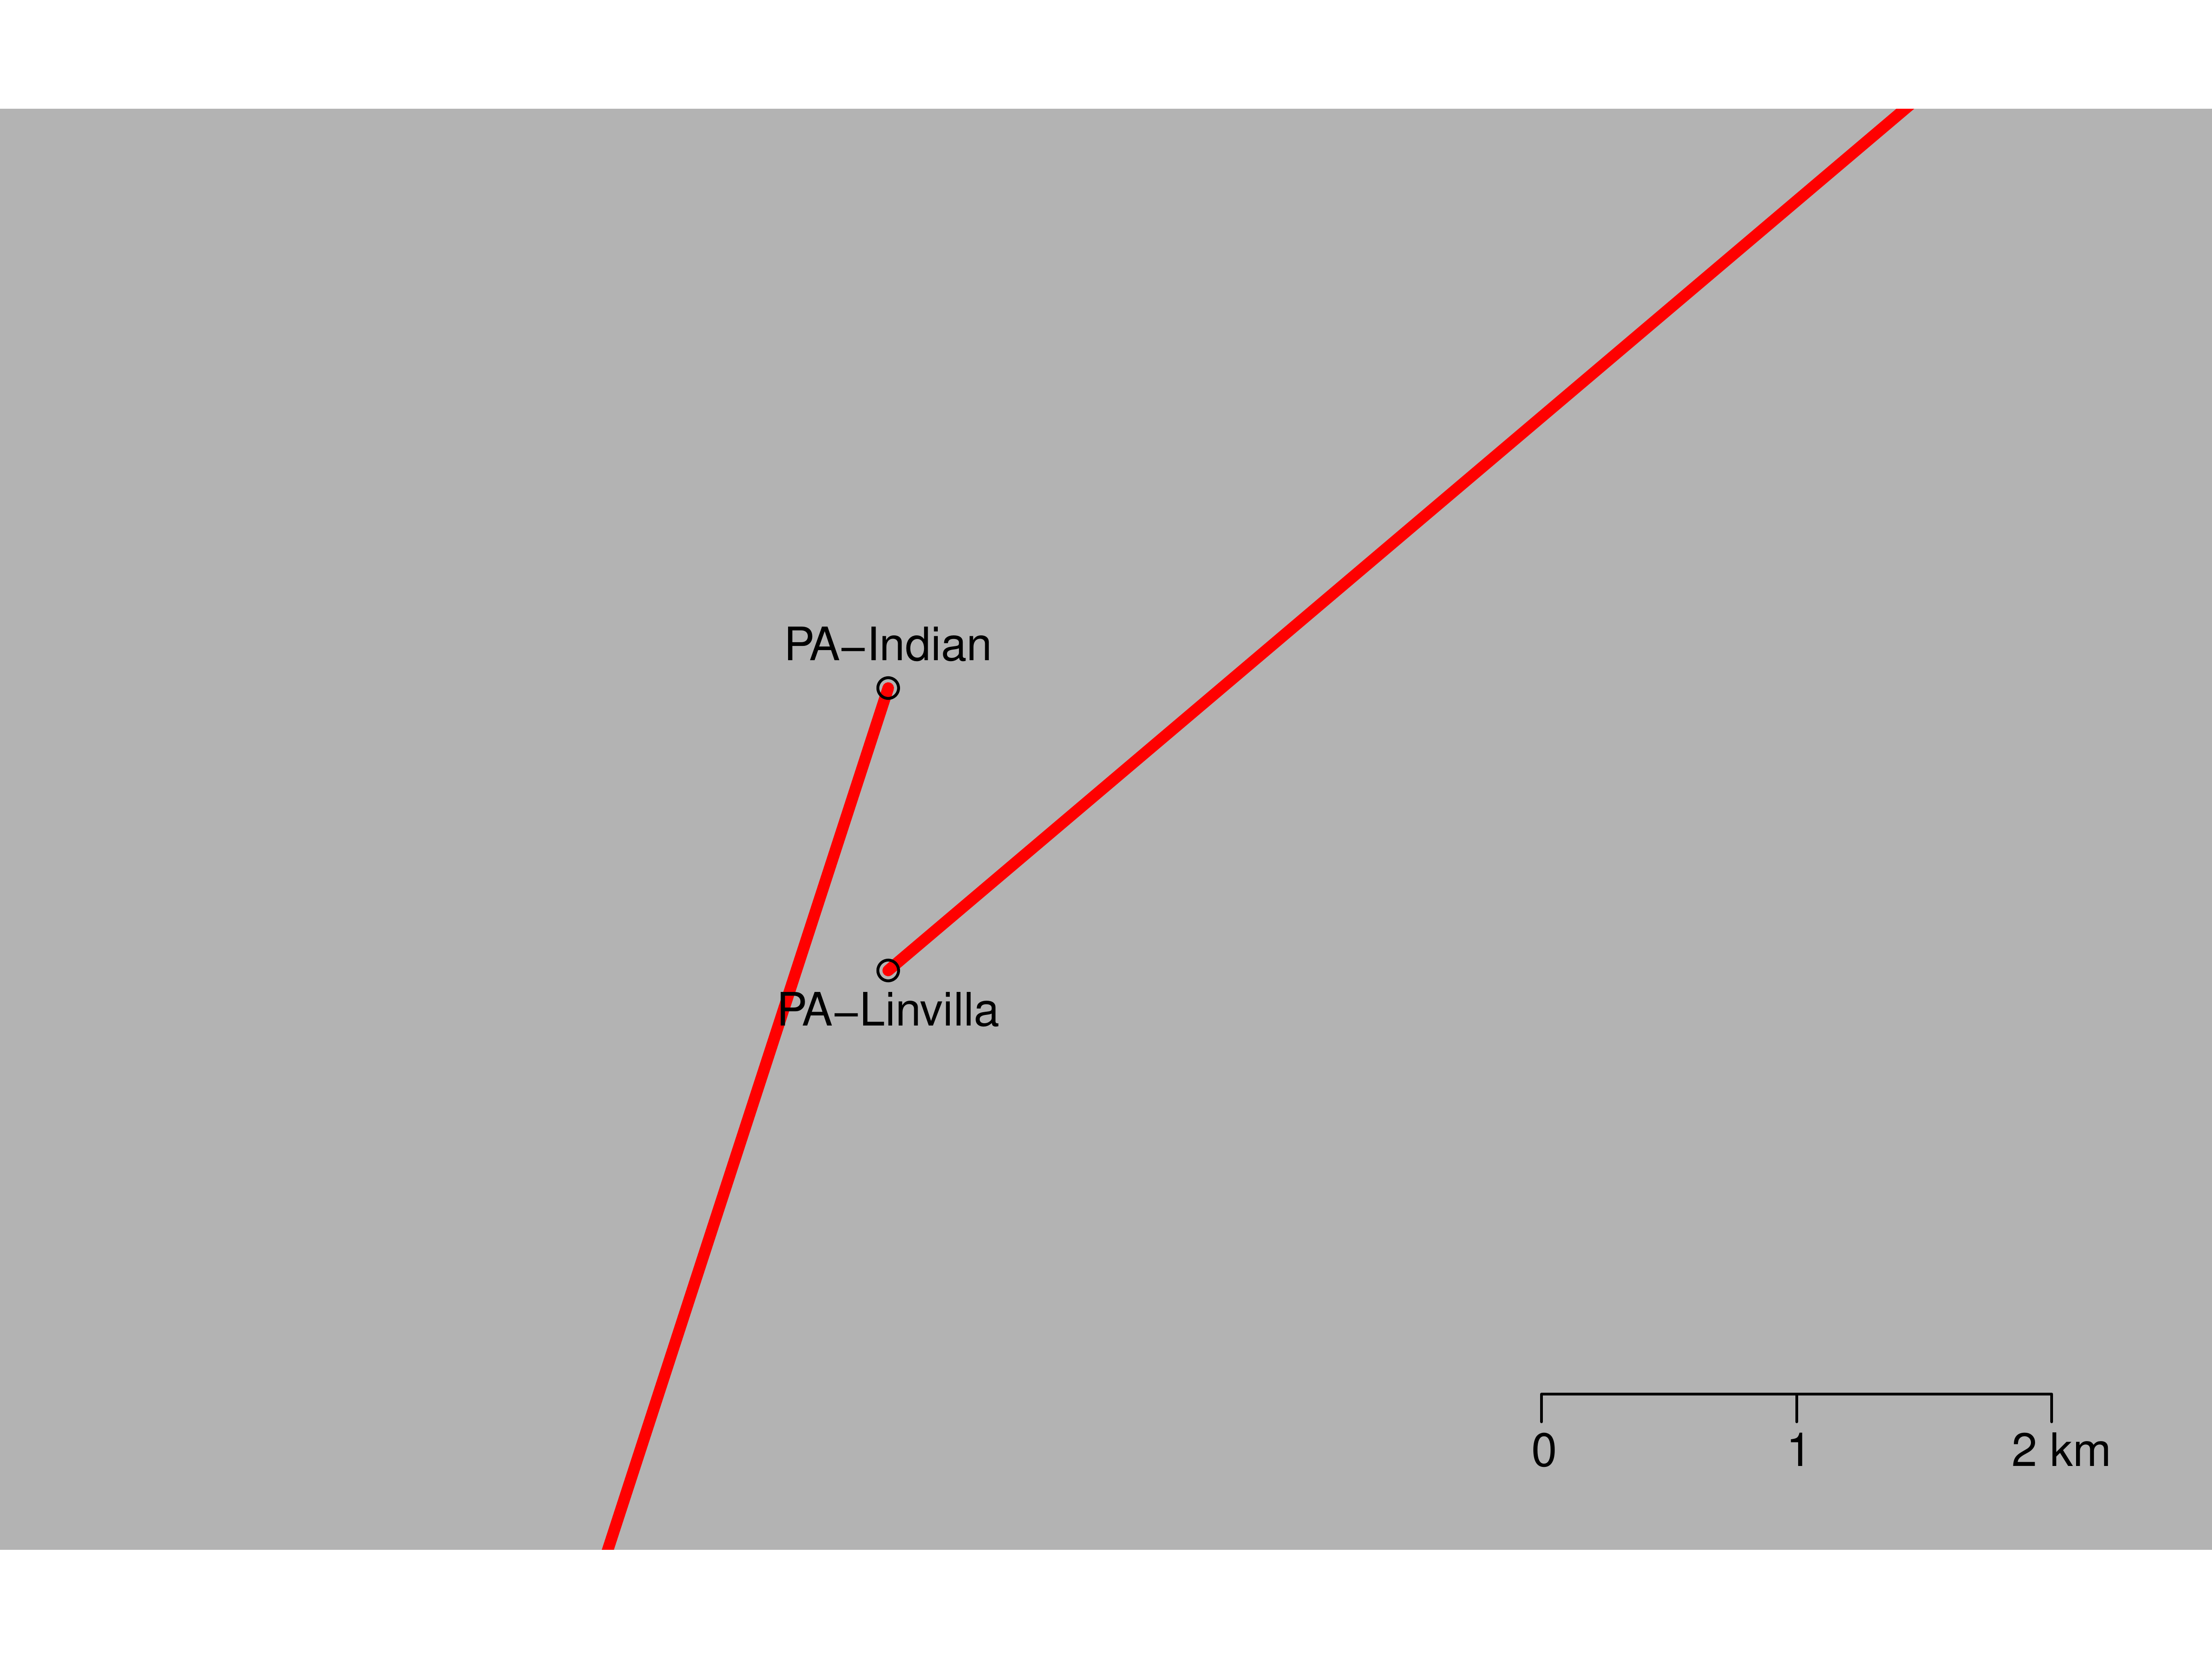
Results: BSSVS
| LOCATION | Zambia | Austria | FL-Mia. | MD-Chu. | PA-Lin. | PA-Ind. | ME-Wel. |
|---|---|---|---|---|---|---|---|
| ME-Eustis | 0.220 | 0.363 | 0.153 | 237.564 | 1.502 | 0.651 | 1 |
| ME-Wells | 0.440 | 0.186 | 0.186 | 21.381 | 0.09 | 0.29 | |
| PA-Indian | 0.401 | 0.744 | 237.564 | 9.371 | 0.153 | ||
| PA-Linvilla | 0.121 | 237.564 | 0.121 | 0.401 | |||
| MD-Churchville | 237.564 | 4.639 | 1 | ||||
| FL-Miami | 7.804 | 0.29 | |||||
| Austria | 0.401 |